There are times when the macro environment moves rapidly and there are times when it seems to stand still. The latest month falls into the latter category. We continue to believe that economic data is pointing to a modest upturn in activity, particularly in those regions hardest hit in the current slowdown.

Zeitgeist: the long-term context

While the global economy can be characterised as late cycle, this does not necessarily portend doom and gloom. Our longer-term thesis of an extended cycle with low growth, low inflation and a lack of imbalances still holds and this is consistent with an outlook in which equity markets should modestly outperform other asset classes.

Weak, but positive, growth is likely to see supportive monetary policy continue and attention is turning to fiscal policy as another potential stimulus to global growth.

Macro drivers: medium-term environment

Recent data has been supportive of our view that macro momentum could be reaching a turning point, responding to the concerted easing of monetary policy this year from central banks globally.

European PMI data has bottomed out and is starting to recover, as is data from other economic bellwethers such as Korea and Taiwan. In contrast, US data has been more mixed as the manufacturing ISM has slid below 50, although the non-manufacturing sector continues to show strength.

We reviewed the spectrum of views across our external research providers and it is clear there is broad dispute between them and little consensus. Recession risk remains high and some research houses believe that recession in 2020 is the central case scenario. Fed tightening in 2018 was a policy mistake, which has triggered the slowing in global trade and will result in recession, notwithstanding recent policy easing.

Others believe that the resilience and strength of the US consumer is key to avoiding recession and that the cycle will continue. A friendly Fed, upswing in the inventory and cap-ex cycle and further corporate earnings growth paints a modestly bullish picture for next year.

Geopolitics is a headwind but the direction of travel for the most important disputes, namely tariff wars between the US and China, seems to be improving.

Signals: short-term indicators

Optimism reached uncomfortably high levels in early November but has since eased off and our sentiment indicators are giving no signal at this stage.

Recent outperformance from value-orientated sectors and the more cyclical areas of the market has reversed although overall momentum has remained positive.

We remain biased towards more positive market scenarios, in particular those that point to modest growth and a supportive policy backdrop. A market melt-up is another scenario which has gained credence recently. Our broad risk indicator has moved slightly higher to between 4 and 5 on a scale from 1 to 10.

Overall

Our asset allocation is unchanged this month. For a moderate risk portfolio, we hold around 33% in fixed income, 40% in equities and 27% in alternative assets (gold and hedge funds).

Equities

Equity valuations remain at a level that is far from speculative, but above long-term averages, implying below par returns ahead.

UK equities have underperformed over the past couple of years, plagued by political and economic uncertainty. We tested the thesis that UK assets are unusually cheap and good value.

It is fair to say that the dividend yield offered by large cap UK stocks, now 4.9%, is attractive by historical standards. But other valuation measures are not so compelling when the market structure is taken into account.

A high proportion of the UK market is represented by oil and mining companies, as well as banks, all of which face challenged futures and trade at lower than average valuations. When comparing UK companies on a global sector basis, their valuation looks no better than their international counterparts.

This sector-based analysis also explains much of the premium valuation enjoyed by the US, where the highly valued tech sector plays an unusually large role.

Fixed Income

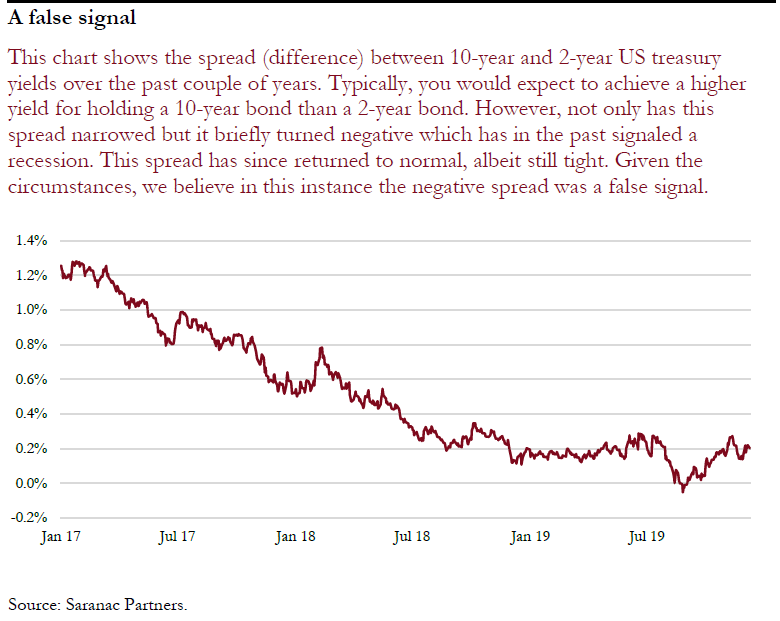
Overall yields have risen in recent weeks, though remain well below levels seen mid-year. Yield curves have steepened and concerns over inverted yield curves, and the implications for recession, have faded.

false signal2

Many portfolios are seeing some short duration government bonds mature at this time. We are taking the opportunity to reinvest the proceeds into longer-dated, high-quality corporate bonds, which offer an attractive spread over sovereign yields but have very little credit risk. The move higher in yields has created an attractive entry point for these longer dated bonds.

Alternative Investments

Our allocation to alternatives is primarily through very liquid vehicles, which trade daily. However, we discussed the opportunities open to us, which might involve funds where liquidity is lower. We believe an allocation of up to 5% of the overall alternatives exposure could be invested in funds with monthly or quarterly liquidity. Currently, we have 2% of most portfolios invested in such a way.

The total allocation to alternatives remains at 21% with a further 5% allocation to gold.

Currencies

Currency diversification is a core belief in our investment process. While we do partially hedge some foreign currency exposure, our approach is very global and sterling portfolios tend to have as much as 30% exposure to non-sterling assets. Consequently, currency movements are important and the 6% strengthening of sterling over the past three months has been a drag on performance.

We analysed the potential outcomes for sterling ahead of the General Election. While a hung Parliament or Labour coalition would be clearly negative for sterling, we concluded a Conservative win would not necessarily be a clear positive for the currency either.

While the Withdrawal Agreement is in place, the terms of any trade deal with the EU are far from clear and the ambitions to deliver a trade agreement by the end of 2020 look highly ambitious.We worry that political brinkmanship and uncertainty with regard to a trade agreement could weigh on sterling in 2020 despite the substantial Conservative majority.

As a result, we are watching for near term strength in sterling as an opportunity to further diversify currency exposure for sterling portfolios.

Portfolio Performance

Current Asset Allocation

Performance

Monthly Returns

Jan Feb Mar Apr May Jun Jul Aug Sep Oct Nov Dec Total
2016 -0.09% 0.74% -1.55% 1.93% 1.00%
2017 0.21% 2.63% 0.42% 0.29% 1.40% -0.36% 0.92% 0.59% -0.38% 1.69% 0.20% 1.39% 9.35%
2018 1.21% -1.18% -1.39% 1.55% 0.55% -0.27% 1.11% -0.49% 0.58% -2.89% 0.64% -2.43% -3.08%
2019 2.97% 0.53% 1.30% 1.85% -1.67%  3.54% 2.49%  -0.96%  -0.36%  0.06%  0.58% 10.71%

Performance figures from inception (28th September 2016) to end May 2017 are based on model portfolios, simulated from a full record of trading decisions and execution levels quoted, are readily available for review. Performance figures from June 2017 onwards are based on an aggregation of actual client portfolios whose mandate most closely follow the Moderate Risk model. Dividends have been included on an accruals basis in both cases. All performance is shown exclusive of fees as charging structures may vary. Your capital is at risk and past performance is not a reliable indicator of future performance.

Source: Saranac Partners, as at 30th November 2019. Inception: 28th September 2016.