Our central scenario continues to be a stabilisation of global growth at low levels and the avoidance of a recession. This is driven by a supportive monetary policy environment globally and the emergence of looser fiscal policy.

Zeitgeist: the long-term context

Our central long-term thesis of slow growth and low inflation remains unchanged and we continue to believe we are not heading for a near-term recession. However, geopolitical factors also continue to play an outsized role in the market outlook and we are therefore taking a cautious view of the economic environment.

Macro drivers: medium-term environment

Our central view of subdued growth and avoidance of a recession in the near term  is supported by a globally accommodative monetary policy and an increasingly supportive fiscal environment. Similarly consumer spending, particularly in the US, remains an area of strength.

However, there has been a clear erosion in aggregate momentum and we have therefore increased our view of the probability of a recession, albeit from a low base. Geopolitics, and in particular the ongoing impasse between the US and China, is leading to a marked slowdown in the industrial economy. Furthermore, we believe there is little impetus for corporate investment to increase in the short term.

Signals: short-term indicators

Market sentiment is broadly negative and there has already been a significant rotation out of equity and into bonds over the summer. There is therefore a limited risk of disappointments in terms of negative macroeconomic data.

Equity valuations are neutral and far from expensive or speculative. However, earnings growth forecasts for 2020 have been largely untouched despite reduced growth expectations for 2019. As a result, consensus expectations appear high and it is probable there will be earnings downgrades in 2020.

Bond yields have fallen sharply in recent months and are at record lows in some countries. As a result, there is a possibility that yields have fallen too far and too fast and may rebound in the near term if the risk of recession declines.

In aggregate and as a broad indicator, our risk appetite lies between 3 and 4 on a scale from 1 to 10. We are therefore cautious on the near-term outlook, but not outright bearish.

OECDgraph

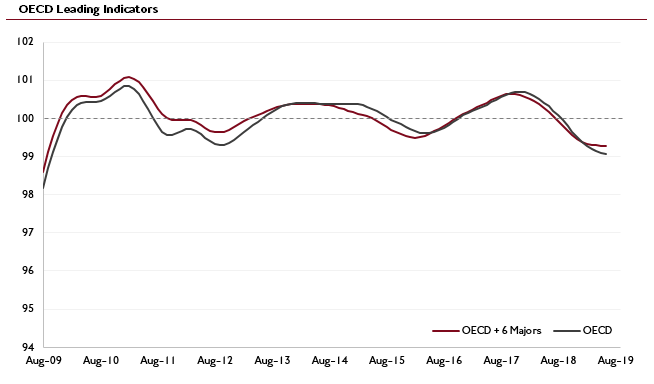
Graph showing the OECD composite leading indicator which highlights the recent loss in moment evidenced by the trend line dipping below the 100 level.  100 represents the long term potential level of economic activity.  This indicator is used to help identify turning points in the business cycle.

Overall

For a moderate risk portfolio, we hold around 40% in fixed income, 35% in equities and 25% in alternative assets (gold and hedge funds).

These allocations exclude the option strategy, which protects about half the equity exposure, significantly reducing the risk.  Furthermore, the allocation to alternative assets is unusually high due to the late stage of the cycle and ultra-low yield environment.

Equities

We maintain our core equity allocation this month but have finished implementing the put option strategy designed to protect against potential falls in the markets. This is in addition to the steps we took last month to de-risk the equity allocation by reducing our exposure to emerging markets and Asia ex Japan, and redeploying capital in the US.

Fixed Income

Having reduced the risk exposure in the equity component of portfolios, we have now taken the decision to de-risk the fixed income allocation.

Specifically, we have reduced our allocation to high yield markets and emerging market debt.

Credit spreads are a key indicator of rising stress and the risk of recession – to date, these spreads have been quite stable. Our decision to reduce high yield and emerging market exposure allows us to lock in gains before any possible widening in spreads.

We have reduced our exposure to emerging market debt by reducing our holding of debt priced in local currency. A strong dollar is a headwind for emerging market assets, lifting the cost of US debts and in general triggering restrictive monetary conditions. However, we have maintained our allocation to emerging market debt priced in US dollars.

The proceeds from these sales have been reinvested in investment grade credit, where the risks of default or widening of spreads is significantly lower.

In considering our fixed income allocation, we are conscious of the speed and extent of the fall in bond yields and the possibility of a rebound in the near term if the outlook improves. We are therefore focused on short-duration investment grade credit, which is less sensitive to any rise in yields.

OECD

Alternative Investments

Last month we mentioned using a call option strategy to participate in any further rise in gold prices. We have been monitoring prices but have not executed the trade as we have not seen an appropriate entry level. We will continue to monitor and consider the implementation of this strategy.

Portfolios currently have around a 20% allocation to alternatives (excluding gold). Despite the cost of such strategies, we believe this allocation is high but justifiable given the expected returns for many conventional asset classes. This allocation consists of a combination of hedge fund and alternative risk premia managers. We have specifically identified strategies which have low correlations with conventional asset classes. These investments have been accretive to returns in 2019.

Currencies

The US dollar has remained a strong currency, despite the pivot by the Fed from raising interest rates to cutting them.

Relatively strong US growth, together with expectations of further quantitative easing from the ECB and a global easing in monetary policy means that the dollar has continued to perform well on a relative basis.

A strong dollar acts as a headwind to emerging market assets, which underpins our rotation out of both emerging market equities and debt.

For sterling investors, Brexit continues to be the key driver of sterling performance.

Portfolio Performance

Current Asset Allocation

Performance

Monthly Returns

Jan Feb Mar Apr May Jun Jul Aug Sep Oct Nov Dec Total
2016 -0.09% 0.74% -1.55% 1.93% 1.00%
2017 0.21% 2.63% 0.42% 0.29% 1.40% -0.36% 0.92% 0.59% -0.38% 1.69% 0.20% 1.39% 9.35%
2018 1.21% -1.18% -1.39% 1.55% 0.55% -0.27% 1.11% -0.49% 0.58% -2.89% 0.64% -2.43% -3.08%
2019 2.97% 0.53% 1.30% 1.85% -1.67%  3.54% 2.49%  -0.99% 10.36%

Performance figures from inception (28th September 2016) to end May 2017 are based on model portfolios, simulated from a full record of trading decisions and execution levels quoted, are readily available for review. Performance figures from June 2017 onwards are based on an aggregation of actual client portfolios whose mandate most closely follow the Moderate Risk model. Dividends have been included on an accruals basis in both cases. All performance is shown exclusive of fees as charging structures may vary. Your capital is at risk and past performance is not a reliable indicator of future performance.

Source: Saranac Partners, as at 31st July 2019. Inception: 28th September 2016.