
In this month’s update we focus on two of our three key trends for the year: economic growth versus elevated valuations and the rotation from growth to value.
Economic growth versus elevated valuations
Over recent months our views on the economic outlook have been trending in a positive direction and this month is no different. Our risk appetite, on average, has moved from 5.5 to 6/10 driven by in particular by the receding risk of negative scenarios. Recession risk has fallen away to near zero probability over the next 12 months and we continue to support the consensus view of a booming economy.
Valuations haven’t changed and remain expensive, however in our view valuations have not separated from reality. This month we have undertaken an extensive analysis of equity valuations across sectors and regions relative to different levels of forecast growth for those sectors. We then compared these metrics with prior post-recession periods to see if expectations and/or valuations were unusually high. We concluded that markets seem to be relatively rational in their expectations now, in particular when considering the relative growth rates of differing sectors and their experience through the pandemic to date. If anything, there is scope for revisions to continue to surprise to the upside and for forecast earnings this year and next to move higher than currently predicted.
Bond market volatility has also eased over the past month and we have seen government bond yields stabilise, yield curves have flattened out and higher risk credit has generally outperformed. This has helped risk assets overall. Inflation fears have been the main cause of concern recently and there has been no data to suggest that it is moving higher yet, let alone running out of control. In addition, the Federal Reserve and other central banks have been at pains to assure markets that they are not going to raise interest rates sooner than planned and that they are willing to tolerate inflation above their 2% target for some time if that means the economic recovery is on a more solid footing and unemployment falls to pre-pandemic levels. As a result market angst about an earlier and more aggressive monetary tightening has eased for the time being.
Rotation from growth to value
Equity markets enjoyed strong returns in March but it was interesting to see a pause in the recent outperformance of value over growth. A stable bond market and flatter yield curve may have been relevant in seeing a weaker performance in financials (the most important value sector), while energy had something of a correction after some very strong returns, in line with the weakening in the oil price. The more traditional growth areas of technology and consumer discretionary performed best, with semiconductors in particular enjoying a very strong month on highly publicised supply shortages.
Despite this month’s reversal, however, we continue to believe that the equity regime remains one that favours value sectors. Cyclical sectors within markets have re-rated to higher valuations than their defensive counterparts, but that is to be expected as their earnings growth is going to be much faster coming out of a recession. When looking at the P/E to growth rate (the PEG ratio), then cyclical sectors look relatively well placed compared to the more quality growth areas of the market.
This has not always been the case. One interesting change has been the improvement in growth prospects for value stocks – in aggregate the PEG ratio of value stocks is now lower than that of growth stocks, a reversal of the position that has held for most of the past decade. Earnings growth has been so weak for value over the last 10 years that despite their cheap valuation, their PEG ratio has been worse than that of growth stocks. The anticipated economic boom over the coming 12 months has seen expectations for earnings growth rise across the market, and now value stocks look attractively priced relative to growth for a given unit of growth.
S&P 500 growth and value – For much of the past 15 years, the P/E to growth (PEG) ratio of value stocks has been higher than that of growth stocks. However, recent improving growth prospects and still lower valuations has seen the PEG ratio of value fall below that of growth, suggesting a more attractive valuation for value per unit of growth.
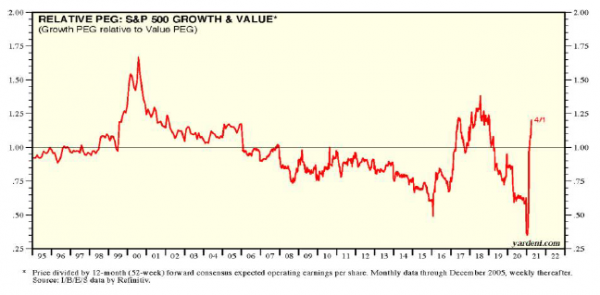
Source: Yardeni Research Inc.
Another sector that also attracted attention was financials. This sector has performed well over the past six months, leading the recovery in value, but it is clear that valuations remain very depressed on both an absolute and relative basis. Despite this, positive earnings revisions are some of the best in the market.
MSCI Financials vs MSCI World – The relative valuation of the financials sector remains at very depressed levels compared with global equities.
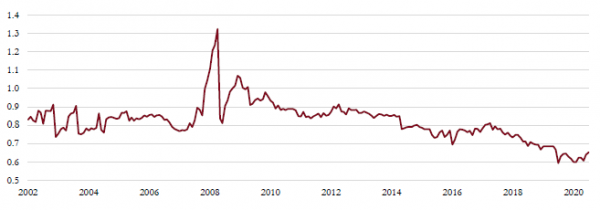
Source: Saranac Partners.
In aggregate, we concluded that the changes we have made to our equity portfolios since last summer have put us in the right position, balancing our core long term growth stocks with more cyclical and cheaper equities poised to benefit from an acceleration in economic growth. However, we are intrigued by the value financial stocks still show and are looking for opportunities in that area.