
Macro environment
There’s an increasingly wide disparity between the economic performance of different regions, much of which can be explained by the varying severity of Covid-19 and responses to the pandemic. China continues to accelerate and will be the first major economy to see GDP output surpass the 2019 peak, as third-quarter GDP posted a year-on-year gain. The extent of the rebound in the Chinese economy can be seen in the performance of highly sensitive commodity prices, such as copper, where Chinese demand is key and prices have hit seven-year highs.
The US is also enjoying reasonably strong growth. Its manufacturing and non-manufacturing survey data is materially ahead of Europe as it has resisted calls to shutter the economy – despite sharply rising Covid-19 cases.
However, the global picture still posted a modest decline in the latest monthly readings as European economies are now in retreat again. The service sector in particular has suffered as a consequence of renewed lockdowns, although the manufacturing sector is holding up better given its ability to operate with social distancing restrictions.
Nevertheless, the most recent macroeconomic data has been subsumed by the remarkable success of a series of Covid-19 vaccine trials, the results of which were released over subsequent weeks in November.
The success rate of these vaccines has lifted confidence for a normalisation of economic activity in 2021, as these vaccines become more widely distributed. Investors are now ‘looking through’ the weak data that is likely over the winter and focusing on the pace of recovery once seasonal aspects of Covid-19 pass and vaccines are readily available.
Given the very easy comparisons with 2020 and the potential for significant pent-up demand, growth rates are set to be the fastest in over a decade in 2021.
Our macro momentum indicators are signalling caution at this stage due to the prospect of negative growth in coming months in many developed economies. However, in another example of how unusual a year this has been, we are inclined to pay less attention to these signals as the promise of a dramatic acceleration in the second quarter of 2021 is increasingly visible and relevant.
Scenarios
Recession risk has diminished in our assessment of possible outcomes from here, driven by the recent success of vaccine trials and expectations around the reopening of economies in 2021. As a result, our aggregate expectations for portfolio returns next year have improved.
We expect slow growth with low inflation as the most likely outcome over the next 12 to 18 months, but also recognise that there is the chance for explosive growth further into next year. This has also highlighted the growing possibility of a market ‘melt-up’, lifted by very easy monetary policy and very strong earnings and economic growth.
Fiscal stimulus is likely to reverse at some stage next year, in part due to the extraordinary level of support seen this year, which is unsustainable. Furthermore, as the economy recovers and returns to growth in 2021, unemployment should fall quickly and the need for fiscal stimulus should diminish sharply.
Sentiment
Risk assets enjoyed one of their strongest ever months in November courtesy of the positive news from vaccine trials and the outcome of the US presidential election. Global equity markets rose an extraordinary 12% over the month, while credit markets also enjoyed strong outperformance relative to government bonds.
However, this has left many markets looking overbought and stretched on near-term sentiment indicators. Surveys such as the bull/bear ratio, as well as money flows into equity ETFs, are now indicating that optimism has reached extreme levels and the risk that near-term news could disappoint is now high
Markets are starting to look overbought
Our internal risk monitor has moved to elevated levels over the past month, a contrarian signal suggesting excessive short-term optimism and momentum currently.
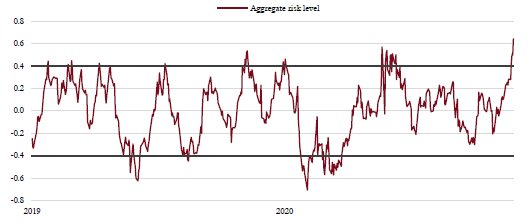
Source: Saranac Partners.
Volatility, on the other hand, has plunged on the back of the very positive moves from markets in recent weeks. The VIX index is now back to 20 – its lowest level since February 2020. While 20 is not particularly low by recent standards, it should be understood in the context of a collapse in volatility to extraordinarily low levels over the past three or four years. The ratio of put to call options traded in the derivatives markets would also suggest markets are positively positioned now.
While the short-term sentiment readings suggest markets may have gotten ahead of themselves, other technical indicators, such as breadth (the proportion of stocks now in uptrends) and earnings revisions have improved markedly. As expectations for 2021 have strengthened, many of the sectors that lagged behind earlier in the year have bounced back and analyst forecasts for earnings growth into next year are likely still too low. These are very supportive factors for markets over the medium term.
Valuations
The third-quarter earnings season was another in which both revenues and profits were much stronger than anticipated and it is clear that the pessimism around corporate profits during the height of the pandemic has proven overly negative. Forecasts for both 2020 and 2021 earnings are being revised higher. However, the sharp move higher in asset prices over recent weeks has outweighed the improving earnings picture. As a result, valuations have moved higher again and the global equity price-to-earnings (p/e) ratio is back above 20 times.
There is increasing debate as to the probability of valuations reverting back to their longer-term averages (the global equity p/e ratio has averaged closer to 15 times over the past 20 years). While we would argue that mean reversion is always a possibility and is far from obsolete as a market concept, there is a
compelling case to be made today that the extremely low level of interest rates – and the fact that central banks are committed to keeping them low for an unusually extended period of time – justify higher equity valuations than has historically been the case.
This argument for higher valuations given the interest rate backdrop is highlighted in another way. Comparing valuations for risk assets between the absolute level and the relative valuation demonstrates the importance of the broader context. The low level of interest rates, and expectation that they will remain there for some time, sees government bond yields below 1% in almost all developed economies. When compared to bond yields that offer so little (over $17 trillion of fixed income assets currently have a negative yield), equity and credit valuations look quite appealing.
The equity risk premium is a popular valuation tool that tries to assess the additional return equities must offer investors above the ‘risk-free’ rate (usually US Treasuries), to compensate them for the additional volatility and risk of loss. Calculating the equity risk premium requires you to estimate the long-term total return of equities, which means it is far from a definitive measure. However, it does show that investors are currently being well rewarded for taking equity risk on a historical basis, given how low the return offered by ‘risk-free’ assets is. Once again, it is more of a relative valuation indicator and it shows a positive picture for equity markets.
S&P 500 equity risk premium
The equity risk premium, here represented by the difference between the earnings yield of the S&P 500 and the US 10-year Treasury yield, shows that equity valuations are reasonable when compared to ‘risk-free’ assets.
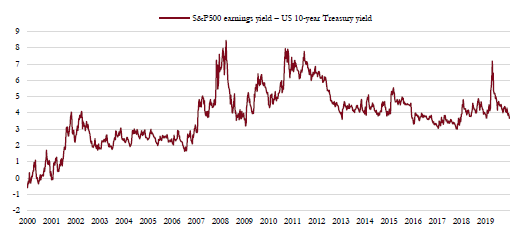
Source: Saranac Partners.
The debate over whether or not equity markets are overpriced will continue, but we have greater confidence in understanding valuations within the equity market and comparing different sectors and styles across equities themselves. Here, the disparity between growth and value remains wide and the cheapness of the more cyclical, value-orientated areas of the market continues to offer more opportunities.
We believe that the recent outperformance of value can persist for some time longer. The prospect for much faster economic growth in 2021 is just the sort of macro environment that can see value do well as growth broadens out to more of the market and valuation becomes more relevant.
However, we are still some way off from embracing a ‘deep value’ approach as the stocks that offer the biggest valuation discount, such as energy and banks, face long-term systemic issues with regard to demand and profitability.
Gold
We have seen gold come under some pressure recently as prices dropped below $1,800 per ounce, falling over 10% from their highs over the summer.
The fall in perceived risk from US politics and the orderly transfer of power to the new Biden administration has eliminated some of the near-term demand for gold. As a result, we have seen a meaningful change in the money flows into gold ETFs. The rush into gold during the summer has slowed – investment in gold was 15% lower in the third quarter than it was in the second quarter.
However, pessimism on the precious metal has reached extremes – an encouraging sign for contrarians – and the underlying support provided by very negative real interest rates is still in place.
We continue to be bullish over the long term on gold and are happy to have an allocation of between 5% and 6% in portfolios at current prices.