
Equities vs Bonds
Over recent weeks global bond yields have dropped dramatically, in some instances to record lows. Such a move is often associated with a worryingly weak outlook and the risk of recession.
Coincidentally, equity markets have bounced strongly and the US stock market just recorded a new historic high. This strength is usually a sign of positive economic momentum and earnings strength.
We focused on whether or not these two asset classes are pricing in entirely different outcomes or if there was some kind of consistency in recent price moves.
Credit spreads, which measure the additional yield offered by riskier bonds over Government bonds, are a reliable gauge as to the perceived risk in the economy. A low, or tight, spread implies confidence in the economy and a view that default by risky bonds is a very low probability. Currently, these credit spreads are falling and it would seem that the credit markets are aligned with equity markets in their belief in a positive economic outlook.
Similarly, the more cyclical and growth-orientated sectors within the equity market (such as Tech and Consumer) have outperformed in this rally. Defensive stocks, such as Utilities and Staples, have lagged behind. Again, this points to a market forecast of renewed growth.
So why have bond yields fallen so sharply? There is a high level of expectation that the US Fed will cut rates this year and next, responding pre-emptively to the disruption caused by trade wars and slowing growth. This ‘insurance policy’ has seen short-dated Government bond yields drop significantly and longer dated bond yields have followed them down.
If central bank policy is successful, then the apparently contradictory moves in bond and equity prices in recent weeks can be justified. The drop in bond yields anticipates easier monetary policy, which in turn should generate faster growth as we move into next year.
However, we would also point out the clear risk – if monetary policy is unsuccessful in stimulating growth then risk assets are pricing in an outcome that is overly optimistic.
US Equity Valuation
US equities are often accused of being too expensive and yet our portfolios typically have a lot of exposure to this market. We looked at the valuation picture for the US to understand if there were risks inherent in the exposure to this asset class.
On traditional metrics, US valuations are in the higher quadrants of their historical ranges. The S&P500 price/earnings multiple trades at 17x prospective earnings and is some 30% higher than other markets.
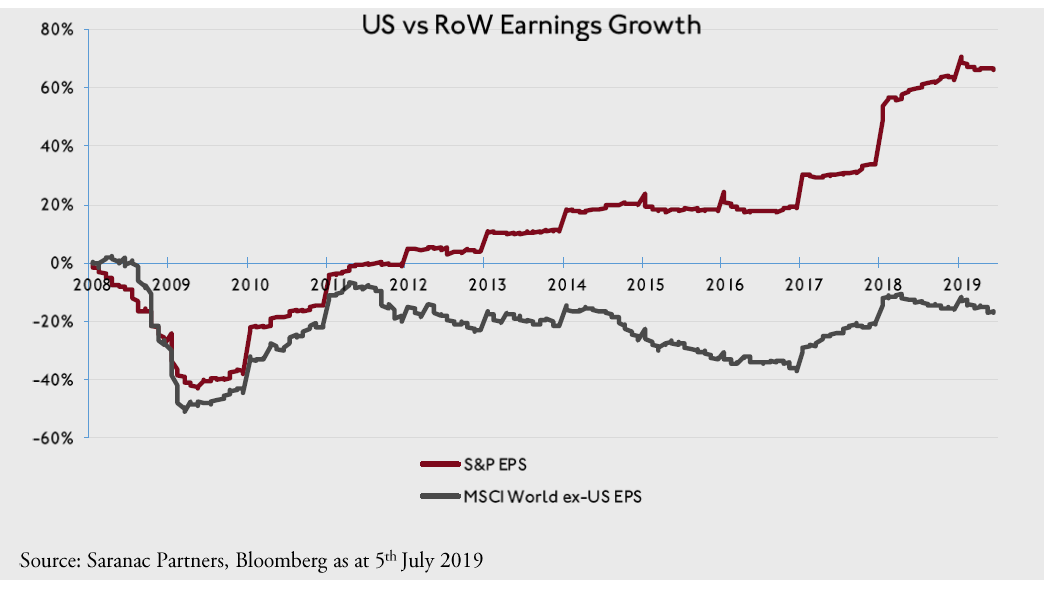
However, this premium valuation looks warranted given the extraordinary outperformance of US corporate earnings over the past decade relative to the rest of the world. US earnings have recovered from the losses of the financial crisis and risen some 70% higher than prior peak earnings. The aggregated corporate earnings of the rest of the world, however, continue to languish almost 20% below the levels they achieved in 2008. Outside the US, there has been little or no earnings growth this past decade.
Furthermore, profit margins and Return on Equity (ROE) in the US are significantly higher than in other regions and have been so consistently over time.
A faster growing and more profitable market deserves to trade at a premium to others and we believe that the US equity market is fairly priced relative to other parts of the world, it is more highly valued for good reason.
An important reason behind the superior earnings picture seen in the US is the preponderance of sectors which tend to enjoy faster growth than most, such as software, medical technology and social media. These sectors, courtesy of their superior growth, trade at higher valuations than average and represent a far greater proportion of the US market than the rest of the world. We think this further justifies the premium valuation.
We also reviewed the role of large-cap, dominant tech companies given concerns that returns from the US market are concentrated in these names. It is not unusual for a handful of large-cap stocks to be responsible for a large proportion of total market return in any year, it is normally the case. But if that concentration is unusually high, or focused on very expensive stocks, then risks rise. However, we see neither excessive concentration nor over-valuation, as many of these large-cap tech stocks generate such plentiful cash that their valuation is in line with the broader market on a free cash flow yield basis.
Gold
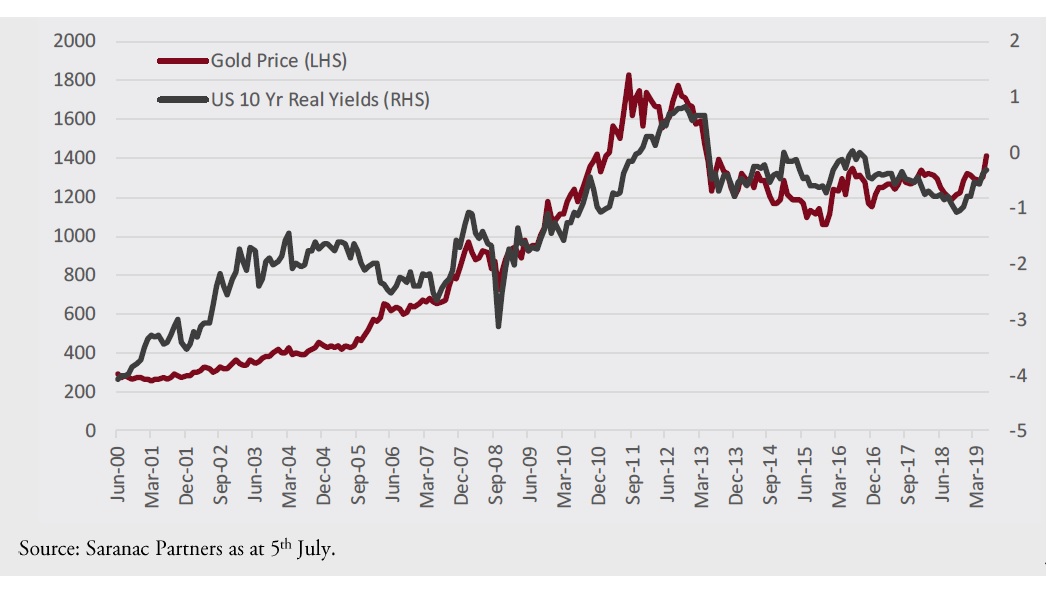
Gold has been topical recently as it has broken out of a long term trading range and risen above $1400. We have held an allocation to gold in portfolios from the start and increased that exposure last year, so we thought it would be helpful to review the investment case and understand if anything has changed.
From a supply perspective, best estimates suggest approximately 190,040 tonnes of gold have been mined, of which two thirds since 1950 and with an estimated 54,000 tonnes still below ground. As such gold supply grows far more slowly than the supply of fiat currencies.
There are 4 key macro demand factors that tend to impact the gold price – real interest rates, the dollar, consumer demand, and Indian and Chinese exchange rates as consumer demand predominantly comes from these two markets.
The fall in bond yields therefore have helped the gold price strengthen. This drop in yields has occurred whilst inflation has been steady, so it is the real yield, or inflation-adjusted yield, that has fallen. Historically, a fall in real bond yields is a powerful support for the gold price.
Structural factors are also impacting the demand for gold, increased interest from Gold ETFs and central banks. Diplomatic rows, tensions in the Gulf and trade wars mean central banks are keen to reduce their dependence on the US Dollar. Over the first quarter central banks bought 145.5 tonnes which represents the largest increase in reserves since 2013. Indeed, since the first quarter of 2015, central banks in China, Russia, India and Turkey have increased their holdings in gold by two-thirds to 4,960 tonnes. To provide some context, approximately 70% of reserves in both the US and Germany are held in gold whereas Russia hold just 18.5% and China 2.5%. The scope therefore to substantially raise gold reserves is vast providing support to the gold price.
Given the above, holding gold not only provides a hedge against political as well as tail risks but, we believe, demand/supply dynamics remain supportive and, whilst not guaranteed, can provide protection in an equity market correction. These are strong reasons to continue being constructive on the metal.
Scenarios
Despite the strong bounce in June across most asset classes, our appetite for risk has not changed and we continue to be comfortable taking a moderate level risk with a score of 4 out of 10. The current environment is one where the risk of a slowdown appears to be levelling off. Global demand hasn’t collapsed, and we don’t expect it to, but it has stalled. Survey data is weakening but, importantly, is still in positive territory. Should the data slip into negative territory then that would raise a red flag. That said, we expect the monthly surveys to stabilise and, for now, still think there could be a pick up in growth later this year.
Collectively, we assigned a greater probability to both the equity melt up and risk premia correction scenarios. This is somewhat at odds but if growth stabilises or picks up then we would expect markets to drive further strong returns. However, the risk that markets have moved ahead of themselves has also increased and could lead to a correction.
The scenario that garners the most votes continues to be an environment where growth is weak and central banks ease policy to stimulate growth. Such an outcome would be modestly positive for portfolios. This view is confirmed by the spread between positive and negative scenarios which continue to bias positive outcomes over the coming 12 months as well as the spread between the most positive and most negative return environment which continues to creep upwards. We currently believe that central bank policy holds the key to a supportive macro theme whilst risks are focused on the cyclical growth outlook and valuation.
Advisory Portfolios
Advisory portfolios, many of which are USD denominated, have benefited from a significant allocation to US investment grade and Treasuries so far in 2019. Given the collapse in US yields, we have tempered new allocations to the space on the expectation that the rally in US rates and credit spreads could be overdone in the short-term.
Trades that have recently been implemented for Advisory clients:
- With US equity markets reaching fresh all-time highs, and a further decline in equity implied volatility, we recommended clients to buy attractively priced put spreads on the S&P500 to hedge part of their equity exposures.
- With the Eurostoxx50 up close to 6% in June and ~19% in the 1st half of 2019, we recommended clients to take profits on their long Eursostoxx50 call exposure, realizing profits in a 147%-226% range.
- We identified 3 US stocks which had sold-off recently, on which we saw catalysts for a share price stabilization and offering attractive levels of implied volatility: Foot Locker, Micron and Halliburton. We structured defensive autocallable notes on these three names, offering 45% contingent downside protection and conditional coupons north of 10% p.a on a 1 year tenor.
- Added to gold holdings. Gold recently broke the long-standing 1,360-1,370 $/oz resistance level in early June. We recommended clients with limited to no exposure to gold to build a position as a hedge against political risks as well as tail risks.
- We recommended clients to roll their Long SEK / Short EUR Forwards, as we remain convinced that the Swedish Krona’s valuation remains cheap, that the Swedish macro data is improving and that EUR/SEK could see further downside from additional monetary easing from the ECB.