Market Perspectives

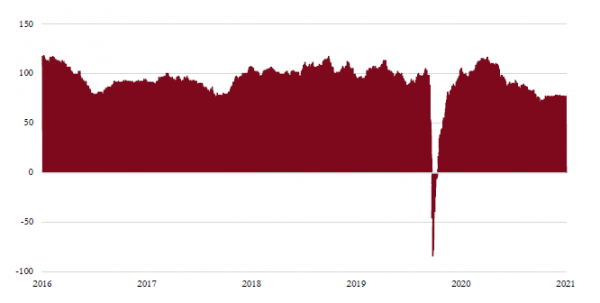
Economic upswing continues unabated, but with some signs that the period of ‘explosive’ growth may be waning. The purchasing managers indices (PMIs) reflect this trend by continuing to indicate a buoyant economy although at a slightly lower level than last month.

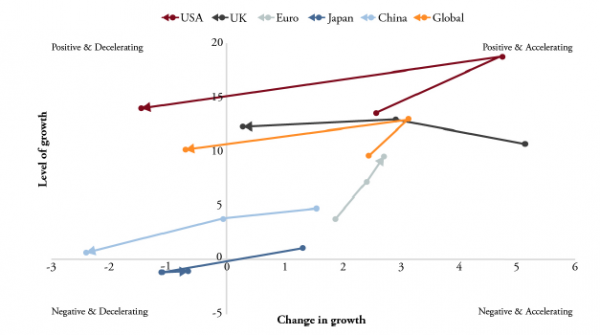
In past investment committee updates we have mentioned how we track the direction and momentum of the PMI data at a global and regional level. The global direction continues to be positive, albeit at a decelerating rate, but the regional indicators are a little more nuanced. Europe was previously a laggard, but has caught up with the US in recent months.


Global Growth Matrix reflects direction and momentum of PMI data – Positive and negative indicate the direction of the PMI number. Accelerating and decelerating indicate the momentum. We typically expect to see the global and regional level move between the top two quadrants. A negative and decelerating outcome can be an effective warning sign.

Source: Bloomberg, Saranac Partners


The trend in China’s economy is a little more worrisome as it points to slowing economic momentum. This is probably more to do with supply driven rather than demand issues. In summary we expect robust growth for the next six months or so. While some moderation is inevitable into next year, as the ‘reopening’ boost fades, we expect a firm growth environment even in 2022.


Monetary policy

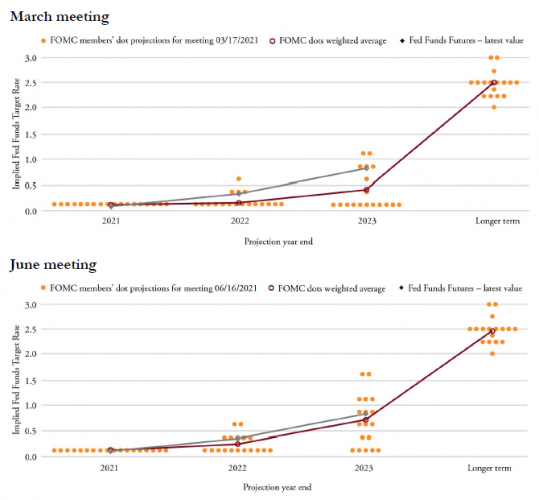
The Federal Reserve (Fed) initially sounded more hawkish in June as policymakers brought forward projections for the first post-pandemic interest rate hike to two interest rates in 2023 rather than waiting until 2024.


Fed market sentiment –The ‘dots’ represent the votes of the FOMC members in terms of level and timing on interest hikes, the red line shows the average weighted level of interest rates given how the FOMC members have voted whereas the grey line represents the market’s view. What’s interesting about comparing the two charts is how much the votes have changed specifically for 2023. This change has brought the FOMC weighted average dot line closer to the market’s view.

Source: Bloomberg, Saranac Partners


This was followed a week later by chairman Jerome Powell’s testimony before the House’s select subcommittee on the coronavirus crisis, which took a more dovish tone. It signalled a more patient approach to scaling back the central bank’s monetary policy support, which depends on evidence of imbalances in inflation or the labour market.

Macroeconomic risks

Last month we focused on inflation and our view that we do not expect there to be a regime change in inflation, has not altered. However, the market’s inflation expectations, as measured by subtracting the real yield from the nominal, has changed. It’s notable that the expectation for two-year inflation has moved down to 2.65% from a high of 2.95% back in May. 10-year inflation expectations have followed a similar trajectory from a high of 2.55% to 2.25%.

Corporate profitability has rebounded strongly in line with the macro picture and has been driven by a recovery in both revenues and profit margins. This has been reflected in equity market returns, which continue to push indices to all-time highs. However, revenue and earnings growth will probably reach a peak this year, which means year-on-year comparisons will be more challenging at the point where policy conversations will move away from the current highly stimulative stance.

We have also witnessed the oil price rise by almost 55% this year. Oil is a big input into the global economy, consequently a material rise can act as a global tax that can impact economic activity.

We acknowledge these risks as relevant. For now though the amount of liquidity that has been pumped into the market supports the global growth story. The US currently holds the above trend growth baton, which we expect will be passed on to Europe.

We feel the longevity of this staggered growth spurt, albeit at a slower pace, might not be fully appreciated and push the above-mentioned risks out into the future. Therefore, it is important to remain vigilant and continue to monitor these risks.

Having taken profit on the Euro Stoxx 50 call option position in June, our target equity allocation within a moderate risk portfolio is about 45% which is a reasonable level of risk given the current backdrop.

Portfolio Positioning

Fixed income

Both government debt and credit inched higher as yields fell and spreads tightened in June. The US Treasury yield curve flattened over the month as short-dated bond yields rose, whereas longer-dated bonds fell following hawkish comments from the Fed suggesting rates might be hiked in 2023. This was a marked shift from a previous median forecast showing the first increase as far away as 2024.

Within investment grade credit, shifting to longer-dated bonds from short-dated will only yield an additional return of around 0.75%. That’s significantly below the long-run average of around 1%, making it unattractive to extend the duration of the credit allocation. For this reason we continue to favour a portfolio with shorter duration (currently around 4.7 years), thereby lowering the sensitivity to a potential rise in yields.

Within lower-rated credit we continue to have a preference for senior loans over high-yield bonds. With a yield of about 3.5% any market sell-off would more than offset the carry that can be achieved. We believe the high-yield market could be prone to some spread volatility ahead of any tapering announcement.


Searching for additional yields – Yield pick-up between bonds with a 1- to 3-year maturity and 10-year maturity.

Source: Bloomberg, Saranac Partners


Equities

Over the course of last year many countries scrambled to fend off the effects of the pandemic by introducing highly accommodative monetary and fiscal policies to help reflate their economies. As these measures began to gain traction we used the opportunity to gradually shift the equity allocation away from a slight growth bias by introducing a number of more value-orientated positions to take advantage of the expected recovery.

Typically, as you rebound from a period of economic contraction, the acceleration of the rebound tends to favour value stocks which usually trade at cheaper valuations than growth stocks. This abundance of economic growth means investors are less willing to pay high multiples for stocks that are expected to exhibit outsized growth in future years. Instead, they pivot to value-orientated stocks, which tend to give you the biggest bang for your buck during the ‘explosive’ growth stage of the recovery.

This more barbell approach has served us well in the equity allocation as we have managed to keep ahead of the MSCI World equity benchmark as we witnessed investors rotate from growth stocks to value. Even as this trend has reversed more recently, we have continued to maintain our relative performance.

The investment committee spent some time discussing whether this reflation trade has now passed and, consequently, shift out of the value stocks by introducing a slight bias towards growth again. We know that corporate earnings will peak in the second quarter and the exceptional growth we are presently experiencing will inevitably revert back to trend.

The unknown factor is the longevity of the above-trend global growth, which is key to establishing whether the reflation trade has more to run. The investment committee thinks that the first half of 2022 could continue to generate strong growth due to the staggered nature of the recovery – from China to the US, on to Europe and, possibly, followed by Japan. If that’s the case then valuations might not reflect this prolonged growth phase.

It is for this reason that the investment committee believes the reflation trade remains intact and has decided to continue with a barbelled equity strategy for now.

Currencies

There have not been many notable moves on the currency front over the past month. We have seen the US dollar strengthen which simply reversed much of the loss from the start of the second quarter. This is probably a function of the Fed signalling that it may raise rates a little sooner than previously indicated.

Traditional safe-haven currencies such as the Swiss franc and Japanese yen have been under pressure whereas the more cyclically exposed currencies, including the British pound and Norwegian kroner, have outperformed.

The lack of available policy options from a monetary and fiscal perspective, coupled with the delayed roll out of the vaccines, means Japan’s economic rebound has lagged other countries. The hoped for boost to the economy from hosting the Olympics is unlikely to materialise, not least as the big events held in Tokyo will now not be open to spectators.

In addition, the Japanese government is looking at policies, such as pushing for lower mobile phone tariffs, which will only add to deflationary pressures. Taking all these aspects into consideration, it’s pretty evident why the yen has failed to find much support this year.

We expect future currency moves to centre on fundamentals and monetary policy. The dollar seems to have few supporters as any strength is soon stifled. The European Central Bank is still dovish, and we cannot envisage a situation in the short to medium term where it will be in a position to raise rates. Market positioning in sterling is still aggressive as expectations are high.

Commodities

We maintain a position of around 3% in gold. Even though we don’t expect a monetary shock over the coming period, we feel the portfolio has a risk-on tilt. Consequently, gold is one of the few diversifiers held in the portfolio. The investment committee had no appetite to change the current weight.

We continue to hold a position to a broader array of commodities through the Baker Steel fund, which has performed well but has not been immune to the recent pullback in commodity prices. Given the committee’s view on the reflation trade, it makes sense to maintain this allocation.

Portfolio changes

Having taken profits on the Eurostoxx 50 call option over the past few weeks, the equity allocation is now lower than last month. The investment committee was not minded to roll the call option into another position with a longer maturity.

Given the outcomes of the scenario scores, the committee felt no compelling need to significantly alter the broad asset allocation. That said, we did discuss a number of tweaks to the fixed income allocation given the recent move in yields and the march closer to the Fed starting to pare back its monthly bond purchases.

Earlier in the year we added a position into asset backed securities through a Morgan Stanley fund that predominantly focuses on US mortgages. This position has performed well for the portfolios but as tapering talk increases there is a concern this could impact the fund. As a consequence, we will trim the position and reallocate the proceeds to a similar fund that is more focused on the European collateralised loan obligation market with high grade issuers.

Within high yield, we see absolute valuations as challenging and, again, talk of tapering could lead to some spread volatility. With this in mind, the committee agreed to further trim the fund reducing the exposure to the space.

Within emerging market debt, both local and hard currency bonds have recovered from their recent lows in March. However, emerging market debt denominated in local currencies is still a long way from its highs. We fear that rising bond yields and a move closer to Fed tapering could not only weigh on these bonds but also cause them to have another move down. For this reason, we believe it prudent to trim the current position.

Lastly, with five-year real yields at -1.9%, the US 5-year TIP we currently hold is unlikely to make us any more money and is now little different from holding cash. Therefore, we have decided to take profits on the position.

Implementing these trades will increase our cash position by about 3.5%. We do not feel there is a great urgency to deploy this cash at present and would rather have it ready for future opportunities.

Portfolio Performance

Current Asset Allocation

Performance

Monthly Returns

Jan Feb Mar Apr May Jun Jul Aug Sep Oct Nov Dec Total
2016 0.74% -1.55% 1.93% 1.10%
2017 0.21% 2.63% 0.42% 0.29% 1.40% -0.34% 0.96% 0.60% -0.38% 1.73% 0.22% 1.39% 9.47%
2018 1.18% -1.17% -1.33% 1.53% 0.52% -0.26% 1.13% -0.47% 0.53% -2.88% 0.74% -2.44% -2.98%
2019 2.91% 0.53% 1.32% 1.88% -1.71% 3.58% 2.58% -0.98% -0.41% 0.09% 0.67% 1.24% 12.21%
2020 -0.97% -1.69% -9.80% 4.26% 3.12% 1.21% 0.94% 1.64% -0.02% -0.23% 3.33% 1.52% 2.59%
2021 -1.17% -0.41% 1.70% 3.17% -0.32% 1.28% 4.26%


Performance figures from inception (30th September 2016) to end May 2017 are based on model portfolios, simulated from a full record of trading decisions and execution levels quoted, are readily available for review. Performance figures from June 2017 onwards are based on an aggregation of actual client portfolios whose mandate most closely follow the Moderate Risk model. Dividends have been included on an accruals basis in both cases. All performance is shown exclusive of fees as charging structures may vary. Your capital is at risk and past performance is not a reliable indicator of future performance.

Source: Saranac Partners, as at 30th June 2021. Inception: 30th September 2016.