
This time do Geopolitics matter?
Historically, geopolitics has had little impact on the momentum of the global economy and has mostly contributed to the noise around the economic cycle, not the signal. However, recent events around trade tariffs could well break the mould.
The view of the Investment Committee a month ago was that the global slowdown, evident since early 2018, was showing signs of an inflection and a recovery beckoned in the 2nd half of 2019. Loosening monetary policy, Chinese stimulus and an easing of trade tensions were key catalysts for this rebound in growth and whilst the first two remain intact, the latter now looks tenuous at best.
Possible tariffs between the US and China, and now also Mexico, could shave 0.2%-0.3% off global growth and offset China stimulus and looser global monetary policy. Risks to the forecast of an improvement in the macro momentum as we move through 2019 have clearly risen and markets suffered a sharp correction through May as a result.
The IC recognises that trying to forecast inherently unpredictable events such as trade policy from the White House is very difficult, but it was noted that there are some constraints on the President. Firstly, Republican Senators and Congressmen have openly criticised the approach of using tariffs as a diplomatic weapon, in particular with Mexico. Secondly, the President has already shown that he sees the equity market as a ‘barometer of his brilliance’ and so there is a case to be made that further downside in equities could prompt a more market-friendly approach from the White House.
Macro-economic Momentum
Economic data over recent weeks has been reasonably stable, despite the geopolitical headlines. The overarching trends of weak manufacturing (notably in Europe) and robust services and consumer confidence remain intact.
Global manufacturing PMIs, which peaked in December 2107, continue to slide. European manufacturing data has stabilised but is at levels implying contraction, whereas the US still enjoys positive growth but this is slipping. As with Europe, China manufacturing has also stabilised at what can best be described as neutral levels.
Non-manufacturing data, the services economy, is still in good health and is showing resilient growth in contrast to the manufacturing picture. Low levels of unemployment, real wage growth and high consumer confidence would argue for further support of the services economy broadly this year.
The Yield Curve
Few economic indicators grab as much attention as an inverted yield curve (where near term government bond yields are higher than those further out in time.) Historically, such an inversion has often preceded a recession, hence its relevance. In recent months the US yield curve has flirted with inversion and in May the US 10yr Government bond yield dropped below that of short term interest rates.
Given that the IC has long insisted that recession risk is low the Committee spent some time discussing the inversion of the US yield curve. It was noted that an inverted yield curve is a necessary, but not sufficient, condition for a recession. In other words, there have been instances of ‘false positives’ over time in which the yield curve has inverted but a recession has been avoided.
The IC highlighted similarities in the yield curve to 1998, the last time such an inversion gave a ‘false positive’ signal, whereas the inversion of the curve in 2006, prior to the last significant recession, looked much more extreme.
The bond market is pricing in between 3 and 4 rate cuts but the Fed by the end of next year, changes that are reflected in the short end of the yield curve. However, the longer end of the curve is upward sloping and implies a more normal environment. The IC believes that the yield curve is not forecasting a recession at this time.
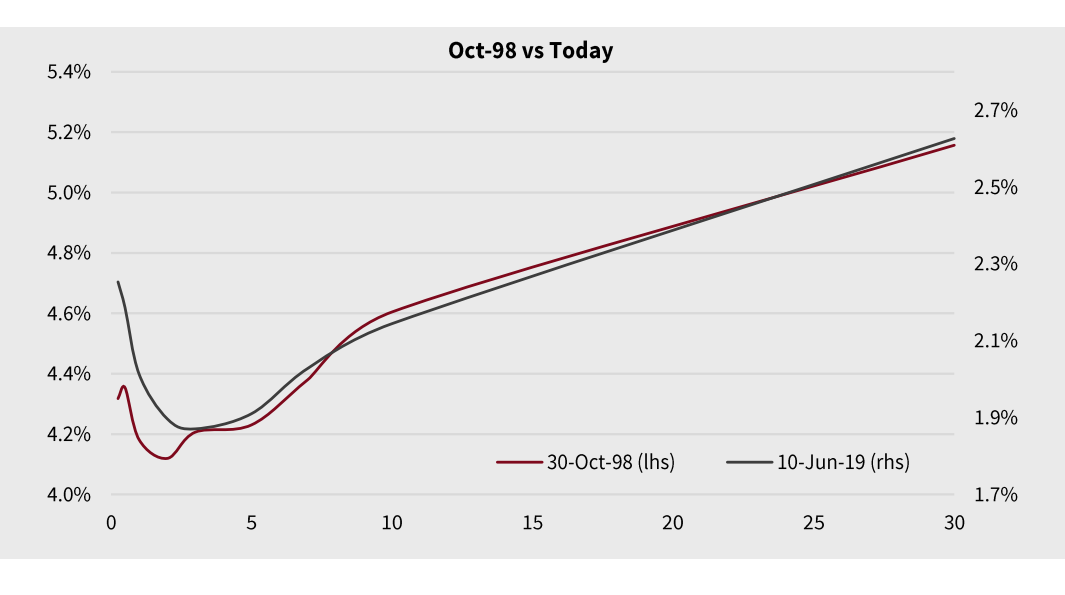
Source: Saranac Partners, Bloomberg as at 10th June 2019
US Profit Margins
The IC discussed the broader impact of tariffs as the consequences of a global trade war extend far beyond the slowing of global growth. As noted earlier, the US – China trade war could shave 0.2%-0.3% off global growth over the next year, a small but meaningful change. However, of greater concern to the IC is the longer term impact on margins.
One of the key supports for the past 10 year bull market in equities has been the consistent improvement in profit margins for companies, particularly those within the manufacturing arena with a global footprint.
There have been several causes for that improvement in margins, lower interest rates and taxes being two of them, but the creation of a global supply chain and the ability to source manufacturing from low cost regions around the world has been central to this trend. A global trade war threatens to reverse that trend and could have dire consequences for the equity market. Namely, expectations of mid-single digit earnings growth this year and next could turn negative and an earnings recession ensue.
Below is a chart from one of our research providers which highlights the move higher in margins for those companies that ‘make something’ in the US over the past 25 years, whilst the others have seen only small gains (these figures exclude financials.)

Source: Saranac Partners as at 10th June, Empirical Research Partners as at 2nd May 2019
Scenarios
The IC noted a modest deterioration in the overall outlook as forecast by the Committee. The positives associated with increasingly accommodative monetary policy from global central banks look to be offset by rising risks to growth, due to the threat of escalating trade wars.
Conviction levels in the various possible outcomes represented by the different scenarios have fallen, a direct consequence of the inherent unpredictability of geopolitics and its increasing relevance.
Whilst the possibility of a slower growth trajectory has risen, the probability of an outright recession over the next 12-18 months remains very low and the IC’s central case remains one of modest growth.
As a result, the IC continues to adopt a risk appetite that it in the middle of its range, the equivalent of 4.5/10, and believes that a well diversified portfolio approach is warranted.
Advisory Portfolios
Advisory portfolios, many of which are USD denominated, have benefited from a significant allocation to US investment grade and Treasuries so far in 2019. Given the collapse in US yields, we have tempered new allocations to the space on the expectation that the rally in US rates could be overdone in the short-term.
Trades that have recently been implemented for Advisory clients:
- Given the increase in oil volatility and some weakness in energy markets, we have traded defensive autocallable structures on crude oil that offer clients attractive income streams
- US rates markets have moved aggressively to price in ~85 basis points of rates cuts through to the end of 2020. We have structured defensive autocallable structures that offer attractive yields, as long as USD 3m Libor rates do not collapse from 2.45% to 0.50% in the next 12 months
- Added to gold holdings below 1,300 $/oz. Gold recently retested the long-standing 1,360-1,370 $/oz resistance level in early June, however has so far failed to break through the upside
- Capital-protected structures offering exposure to various underlying investments, ranging from US equities to gold
- Tail risk hedges against a further escalation in trade tensions, including put spreads on German and Taiwan equity ETFs, as well as EM FX options
- Added exposure to portions of the US energy sector, both producers and services companies on the back of recent weakness, e.g. EOG Resources and Halliburton
- Added to technology names that have lagged, such as Alphabet Inc., which has been weak following Q1 earnings and the announcement of potential new anti-trust investigations in the US
Source: Saranac Partners, Bloomberg, as at 10th June 2019
Market Review
| Equities | Level | 1 Month | 3 Months | YTD |
| US (S&P 500) | 2,752 | -6.35% | -0.67% | 10.73% |
| UK (FTSE 100) | 7,162 | -2.86% | 2.63% | 8.80% |
| Europe ex-UK (EuroStoxx 50) | 3,280 | -5.07% | 1.97% | 12.42% |
| Japan (TOPIX) | 1,512 | -6.53% | -4.86% | 2.42% |
| Emerging Markets (MSCI) | 998 | -7.23% | -4.44% | 4.16% |
| Government Bonds – 10 Year |
Yield | 1 Month | 3 Months | YTD |
| US | 2.12% | 3.22% | 5.53% | 5.80% |
| UK | 0.89% | 2.25% | 3.30% | 3.29% |
| Germany | -0.20% | 1.82% | 3.32% | 4.30% |
| Japan | -0.09% | 0.40% | 0.49% | 0.76% |
| Credit | Yield | 1 Month | 3 Months | YTD |
| UK Investment Grade | 2.57% | 0.83% | 3.43% | 5.39% |
| Global High Yield (£) | 6.56% | 2.36% | 5.80% | 7.22% |
| EM $ Debt | 5.26% | 0.62% | 2.39% | 6.50% |
| EM Local Debt ($) | 5.50% | 0.22% | -0.77% | 3.00% |
| Currencies | Level | 1 Month | 3 Months | YTD |
| GBP / USD | 1.263 | -3.17% | -4.79% | -0.92% |
| EUR / USD | 1.117 | -0.43% | -1.87% | -2.47% |
| EM Currencies / USD | 61.51 | -1.51% | -3.29% | -1.20% |
| Commodities | Level | 1 Month | 3 Month | YTD |
| Broad | 2,391 | -8.21% | -4.08% | 8.53% |
| WTI Crude Oil | 53.50 | -16.29% | -6.50% | 17.82% |
| Gold | 1,306 | 1.71% | -0.74% | 1.87% |