In this month’s update we assess the current inflation environment, the debate over its most likely future path and where we sit in that debate.
Indications of a positive backdrop
Our macro momentum indicator is showing very strong, and accelerating, growth in the US, Europe and the UK. This should be a positive backdrop for risk asset returns. China growth has already started to slow, given how much earlier it saw the surge in growth post-pandemic. Japan remains the outlier with little growth and little improvement, in part due to the very slow vaccination programme.
Our outlook continues to favour outcomes which are positive for portfolios, although very strong returns from here seem less likely as the ‘melt up’ scenario of lower bond yields and a valuation re-rating of equities has already happened, in part.
It has also become clear over recent months that the team sees the possibility of a significant shift in the inflation regime as being a tail risk now, albeit a low probability one. Such a scenario would probably have the worst outcome for portfolios as they stand, implying both a negative return in bonds (due to higher yields) and equities (due to a de-rating of valuations) with few effective diversifiers of risk other than cash or the derivatives market. Given that risk, the inflation picture is something we are paying keen attention to.
Despite higher inflation readings, bond markets have been very well behaved with little movement in credit spreads and a very gradual move lower in bond yields back to levels last seen in early March. Indeed, longer term inflation expectations seem to have reached a near term peak and have dropped back a little in recent weeks.
Equity markets too have been well behaved with relatively little volatility, although they have mostly been moving in a sideways range. The drift lower in bond yields has helped the more growth-orientated areas of the market where valuations had previously been under pressure due to higher inflation expectations, thus we have seen tech perform better recently and the rotation out of growth and into value has stopped for the time being.
Portfolio Positioning
We made no changes to portfolios over the past month, although we are discussing what to do with the call option where it is held. This option now has barely a month until expiry and over that period the ‘time value’ of the option will gradually decay to nothing. Given that this time value currently represents a meaningful component of the option’s overall value, we are looking closely at the timing as to when to sell the position. The strategy has performed well for us and the option is ‘in the money’, given the modest rise we have seen in underlying equity market (the European EuroStoxx 50 index), since we bought the position, so we are keen to ensure we lock in those gains and sell the position in the near future.
Clearly inflation has been at the forefront of investor’s minds in recent months and it remains the key macro variable that is likely to determine both policy and market direction in the near future. As such we thought it would be helpful to lay out how we see the current inflation environment, the debate over its most likely future path and where we sit in that debate.
Inflation update
Where are we now?
2021 has seen a significant move higher in both inflation expectations and inflation itself.
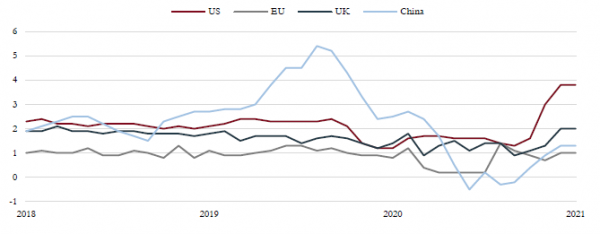
Global core CPIs – CPI data is reflecting the respective growth rates of different regions, China CPI has already spiked and fallen back whilst US CPI has moved sharply higher in the last 2 months. European and the UK CPI has yet to move.
Source: Bloomberg, Saranac Partners.
Inflation expectations were first to move, 10-year inflation-linked government bonds in the US have seen break-evens (the level at which the market expects inflation to average over the bond’s lifetime) steadily increase from their lows of 0.55% post pandemic up to 2.5%. Expectations were about 1.75% prior to the outbreak of Covid-19.
Shorter term inflation expectations have risen even further, five-year break-evens rose from 0.2% at their trough in March 2020 to 2.75% in May, having been around 1.6% pre-pandemic.
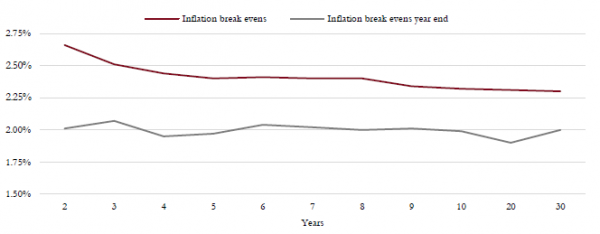
US inflation break-evens – US inflation break-evens, a good proxy for inflation expectations over time, have moved higher this year across all maturities. But we also see short-term expectations for inflation are higher than longer term forecasts. This highlights the market view that the rise in inflation we are seeing now will be transitory, as predicted by the Fed.
Source: Bloomberg, Saranac Partners.
UK inflation expectations have been less volatile than in the US and never collapsed in the way they did in the US during the initial outbreak of Covid-19. But we have still seen 10-year inflation break-evens move from 2.8% to 3.5% over the past year.
Headline inflation numbers are now starting to accelerate as well, the US consumer price index (CPI) in May rose 5% year-on-year, having started the year at just 1.4%. Core CPI is now rising at a 3.8% rate, the fastest since 1992. The Core PCE Deflator, a key inflation indicator for the Fed, has also risen from 1.4% at the beginning of 2021 to 3.1%, again a number not seen since the early 1990s.
However, it should be noted that prices have yet to show the same kind of acceleration everywhere. Core CPI is just 1.3% in the UK and a mere 0.9% in Europe.
Why has it risen?
One clear reason for the strong inflation numbers today is the base effect. This is the effect of unusually depressed inflation numbers this time last year, caused by the strict lockdowns put in place following the first pandemic wave, and the collapse in commodity prices, particularly oil. The gradual normalisation of activity over the past year means that as we annualise these unusually low inflation numbers, current price levels look significantly higher than where they were 12 months ago. This is less to do with ‘high’ inflation now, and more to do with artificially low prices a year ago.
Commodity prices have enjoyed a boom over the past year, in part driven by strong Chinese demand as they have emerged from the pandemic first. Copper prices have hit all-time highs, iron ore has almost doubled in 12 months whilst even the oil price is now higher than where it was in 2019, supported by OPEC production cuts but also a lack of investment globally. Housing booms, in particular in the US, have seen lumber prices more than double over this past year.
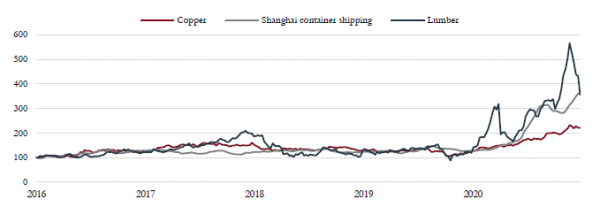
Commodity price inflation – Lumber prices and the cost of container shipping are good examples of supply disruptions and strong demand squeezing prices higher; we expect these to normalise in time. Lumber prices have already corrected sharply from their peak.
Source: Bloomberg, Saranac Partners.
Disruptions to supply chains during the lockdown phases have clearly upset the supply-demand balance in certain parts of the economy and this is creating bottlenecks and some price inflation. Semiconductors is a good case in point – the auto manufacturers were quick to cancel orders in early 2020 and were caught by surprise at the speed with which demand recovered. However, semiconductor manufacturing is a complex process and cannot be simply switched back on, it can take weeks or months to recover lost output and now we see many of the auto manufacturers having to cut production due to a shortage of semiconductors. Another good example is the cost of seaborne freight; container shipping costs from China have trebled since last summer as containers have stacked up empty in US and European ports, unable to re-fill for the return journey due to lockdowns. This squeeze on supply is causing prices to move higher in specific parts of the economy, until such time as these bottlenecks are cleared.
Does it matter?
Monetary policy is fundamental to the business cycle. Inflationary pressures, normally accompanied by strong growth, elicit higher interest rates from central banks until such time as interest rates rise to a level that triggers a credit problem, growth slows and recession often follows. This typical business cycle would suggest that current rising inflationary pressures should be viewed with some caution.
However, this cycle looks a little different in that central banks, the Fed in particular, have made it clear that they are willing to tolerate higher levels of inflation than we have experienced historically before they will entertain the idea of lifting interest rates.
Having experienced two decades of inflation below the targeted 2% level, Fed policy makers have now ‘moved the goalposts’ and declared an average inflation target, rather than a ceiling. In this way the Fed is now able to tolerate inflation well above the 2% target as it is simply ‘catching up’ from the many years of sub-2% price pressure we have experienced. Indeed, the Fed have made it clear that they would welcome a period of stronger inflation such is their concern that the US economy slips back into a pattern of sub-target inflation.
Another important distinction to understand is that inflation is a persistent acceleration in prices, not just a one-off change in the price level. Again, the Fed has been at pains to assure the market that it sees the current inflationary environment as transitory, not as a more permanent shift to higher inflation. Fiscal policy is set to become less expansionary as emergency unemployment benefits and furlough schemes come to an end. Employment levels should rebound as lockdowns end and schools re-open and supply disruptions should ease. These are all good reasons to believe that the spike in inflation this year should prove only temporary.
Wage inflation is one of the most important inputs to the overall inflation situation and, at this point, it would seem that there are moves in the relative price of some wages, rather than an absolute move in the price of all wages. There is anecdotal evidence aplenty of labour shortages in the hospitality sector and rising pay levels there, however, the opposite is also true of other sectors where lockdown and travel restrictions still apply, such as events, airlines and hotels.
So, with central banks viewing inflation ‘on average’, rather than as a specific target, and believing that inflationary pressures will wane as we move into 2022, there is little urgency from policy makers to lift interest rates in the face of the current rise in prices.
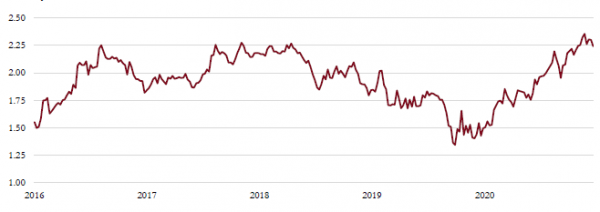
Inflation expectations – Five-year inflation
Source: Bloomberg, Saranac Partners.
This is a view that seems to be shared by the market as inflation expectations, and bond yields, have actually fallen in the past month, reversing some of the moves higher earlier this year.
If interest rates remain stable, then this current period of higher inflation should not be seen as a threat to markets.
What could go wrong?
This period of unusually strong growth is expected to last until later this year. However, if this growth extends for longer than that, this could lead to pricing pressures remaining elevated and central bank confidence in the transitory nature of this inflation could be shaken.
Inflation is a lagging indicator, not a leading one. Thus, as the evidence comes through that inflation is remaining stubbornly high it might lead to concerns that central bank policy is behind the curve and they have let the inflation genie out of the bottle.
This could result in a much faster, and stronger, tightening cycle which is often the catalyst for a bear market.
What do we think?
We have discussed this a number of times in recent months and continue to believe that the pandemic has not triggered a regime change in the inflationary environment.
The trend toward globalisation may have slowed or even stalled, but we do not think it is reversing and there continues to be a large, global pool of labour from which to source manufactured goods.
Technology remains a powerful disinflationary force which is likely to accelerate in its ability to raise productivity and restrict inflationary pressure.
Over the past 20-30 years it has been true that the best explanation for inflation is that ‘it is what people expect it to be’. Independent central banks and a policy of targeting a given level of inflation have been hugely successful in managing inflation expectations. None of that should change in the near future.
There is a strong argument that the demographics of the world are changing and the huge growth in the workforce of the past 30 years, courtesy of the baby boomer generation and the entry of China into the global economy, is coming to an end. This could lead to higher inflation as the availability of a large, cheap labour force shrinks. However, these forces change very slowly and fail to consider the impact of both India and sub-Saharan Africa over the coming decades. We do not think this impacts inflation in the near term.
A dramatic shift in economic policy orthodoxy could lead to a regime change in inflation. Modern Monetary Theory (MMT), which proposes higher state spending to stimulate growth and ever-growing deficits to fund that growth, has been gaining popularity. Yet it remains far from being generally accepted or adopted and would require the dissolution of the independent central bank model. As such, we do not see this as a threat in the medium term.
While we expect nominal bond yields to move higher over the rest of the year, to reflect stronger growth and the tapering of quantitative easing, we are not looking for a material shift in yields or inflation expectations from current levels.
Portfolio Performance
Current Asset Allocation
Performance
Monthly Returns
Jan
Feb
Mar
Apr
May
Jun
Jul
Aug
Sep
Oct
Nov
Dec
Total
2016
0.74%
-1.55%
1.93%
1.10%
2017
0.21%
2.63%
0.42%
0.29%
1.40%
-0.34%
0.96%
0.60%
-0.38%
1.73%
0.22%
1.39%
9.47%
2018
1.18%
-1.17%
-1.33%
1.53%
0.52%
-0.26%
1.13%
-0.47%
0.53%
-2.88%
0.74%
-2.44%
-2.98%
2019
2.91%
0.53%
1.32%
1.88%
-1.71%
3.58%
2.58%
-0.98%
-0.41%
0.09%
0.67%
1.24%
12.21%
2020
-0.97%
-1.69%
-9.80%
4.26%
3.12%
1.21%
0.94%
1.64%
-0.02%
-0.23%
3.33%
1.52%
2.59%
2021
-1.17%
-0.41%
1.70%
3.17%
-0.34%
2.93%
Performance figures from inception (30th September 2016) to end May 2017 are based on model portfolios, simulated from a full record of trading decisions and execution levels quoted, are readily available for review. Performance figures from June 2017 onwards are based on an aggregation of actual client portfolios whose mandate most closely follow the Moderate Risk model. Dividends have been included on an accruals basis in both cases. All performance is shown exclusive of fees as charging structures may vary. Your capital is at risk and past performance is not a reliable indicator of future performance.
Source: Saranac Partners, as at 31st May 2021. Inception: 30th September 2016.