Asset prices and valuations are both high but we don’t believe we’re in a speculative bubble. Notably, our proprietary risk indicators are not extended. The economic cycle has rolled over and passed peak growth, but overall activity remains above trend.
While inflation is high, it is probably close to its peak. Covid-related distortions should recede over the next year and the pace of price increases will moderate, but by how much is debatable. Questions remain about the stickiness of wage inflation, which is where we are most focused.
Bond markets seem to be accurately predicting monetary policy and we have little argument with the forward curve. Quantitative tightening in the US is likely to start this year but it is well expected and shouldn’t unsettle markets too much. We expect the US Federal Reserve (Fed) to gradually hike rates in late 2022 and 2023.
There is broader market participation as reopening trades and cyclical sectors have performed better in recent weeks, although growth remains the dominant factor, as it has since April. We are not taking large bets in portfolios at the moment, and instead targeting a modestly above-average level of risk.
On a 12-month view, we see a small incremental risk of recession creeping into our forecasts for the first time. Yet concerns of a de-rating or a large valuation correction have diminished somewhat.
Macroeconomic overview
There has been a noticeable slowdown in consumer confidence and purchasing managers’ indexes (PMIs), mostly related to the spike in Delta cases. China’s growth is slowing, but it is unclear at this stage whether the dip in data has been exacerbated by temporary lockdowns and floods. Authorities have suggested they can assist through fiscal and monetary channels should weakness persist.
Absolute levels of growth are well above trend going into 2022, even if slower than in the second quarter. Covid-related supply disruptions are lasting longer than expected, but should resolve themselves by the first half of 2022. The recent moderating of the growth backdrop could actually extend the recovery period which may prove a positive support for markets.
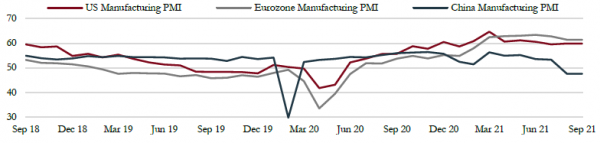
Business confidence has started to dip- Manufacturing PMI surveys have seen a pronounced slowing in China but have also started to see a rolling over from very strong levels in the US and Europe.
Source: Saranac Partners
Portfolio Positioning
Fixed income
Despite concerns of a bubble, we believe we can explain why bond yields are so depressed. Secular stagnation in growth over the past decade, primarily due to shifts in demographics and ageing populations, unequal income distribution and high debt levels has led central banks to keep short-term interest rates at low levels.
A lack of inflation, given this shortfall in growth, has helped keep interest rates low and also driven government bond yields more generally to low levels relative to previous decades. These are the key drivers of the low interest rate/bond yield environment we have had since the financial crisis.
In many regions central banks have been unable to cut interest rates low enough to stimulate demand or achieve their inflation targets. As a result, they have adopted increasingly unorthodox monetary policies, such as quantitative easing (QE), which has eased monetary conditions further still. The evidence is mixed about the results. It seems to have had only modest impact on long-term bond yields in the US and UK but has been more effective in lowering yields in Japan and Europe.
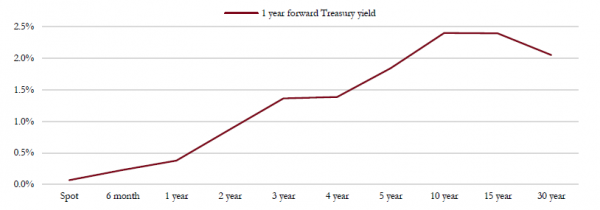
In our view, increasingly robust and clear central bank guidance is helping to anchor short-term bond yields close to 0%, which in turn is influencing the level of long-term yields. Short-term yields imply a first rate hike in late 2022 followed by two hikes in 2023, which we think is reasonable. The shape of the US Treasury yield curve looks normal to us. The 1.1% difference between two- and 10-year yields is in line with its 10-year average.
US Treasury forward curve –This chart shows current market forecasts as to where the one-year US Treasury yield will be in the future; it implies an increase of 25bp in interest rates by this time next year and another 50bp rise in rates within two years.
Source: Saranac Partners.
The forward curve implies that the Fed will raise interest rates close to 2% over the next five years and will be able to keep them at this level for some time. We largely agree with this outlook. As a result, with the forward yield curve pricing in a sensible path for interest rates, there is limited scope to argue that bond yields are currently wildly mis-priced. However, tapering of QE later this year may see a modest increase in longer-term bond yields, while inflation expectations may rise as well if inflation data remains elevated for longer than expected.
Therefore, we think there is scope for the US 10-year Treasury yield to rise to a 1.5-1.7% range by year-end. However, we would see any overshoot beyond these levels as an opportunity to increase the duration of our fixed income portfolios.
Equities
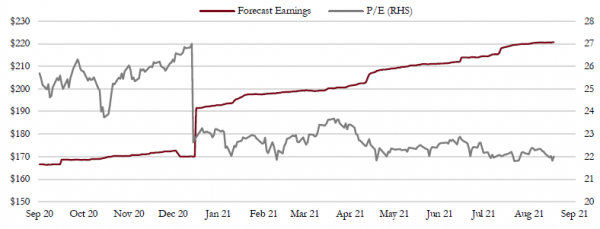
Operational leverage is still highly relevant. So far this year we have seen 20% earnings surprises, driving forecast earnings for this year and next significantly higher and at a pace faster than the market has risen. Hence equity valuations are actually cheaper today than in January.
Revisions to S&P 500 earnings and valuations –Strong revisions to earnings forecasts and robust growth has helped lower valuations over the year despite decent gains for most markets.
Source: Saranac Partners.
We believe it is time to differentiate between reopening trades, cyclical stocks and broader value characteristics. We still want cyclicals and reopening trades in portfolios. Valuation is compelling, relative to growth, and there is little recovery discounted from here. However, traditional value areas of the market such as banks and energy have already rallied significantly and the easy gains from these sectors may be behind us.
The speed of reopening has been disappointing, but this means that the recovery is more extended and operational leverage should continue to benefit for several quarters, rather than a short, sharp bounce. Sensitivity to the Delta variant has hurt reopening trade ideas the most, and more so than value.
We think the most attractive upside remains in these names. There is scope to recover their underperformance as developed economies continue to adjust to life with Covid and we see six to nine months of above-trend growth ahead.
Developed markets have significantly outperformed their Emerging Market counterparts this year and much of this is due to the fact that China has been a meaningful laggard this year, courtesy of slowing growth, negative earnings revisions and now a regulatory squeeze. But monetary policy may be swinging from a headwind to a tailwind given these growth challenges and a renewed credit cycle in China should be a positive for the region.
Commodities and currencies
There has been modest volatility in gold recently, which has been trading around $1,800 for much of the summer. While it is surprising that it didn’t respond more positively to the fall in real bond yields, evidence suggests that central banks have picked up their buying of gold reserves.
China’s curbs on steel production have hit iron ore markets hard, with prices falling over 40% from their summer peak. However, the broader commodity complex has otherwise been stable.
Currency volatility has been unusually low, with the market generally lacking conviction in a strong foreign exchange view.
Portfolio changes
The consensus is that economic growth is now slowing, but a move by many major economies to a strategy of living with Covid rather than locking down could see above-trend growth continue for longer than expected. The improved participation across equity markets and rebound in more cyclical areas suggests this is possible and would be supportive of further positive earnings surprises.
Market positioning is heavily tilted toward downside protection but we see risk of further market upside into the year-end, given the potential for positive surprises from corporate results and continued central bank support. As a result, we are raising the equity weight in portfolios through a combination of additional exposure to attractively valued growth stocks in the US and a call option on the S&P500 index.
We are also introducing a new, actively managed Japanese equity fund to portfolios, which will replace the current passive ETF approach and modestly increase our exposure to Japan. We are funding these changes using the cash that has accumulated in recent weeks through the reduction in our fixed income allocation as yields and credit spreads had fallen to unattractive levels.
Portfolio Performance
Current Asset Allocation
Performance
Monthly Returns
Jan
Feb
Mar
Apr
May
Jun
Jul
Aug
Sep
Oct
Nov
Dec
Total
2016
0.74%
-1.55%
1.93%
1.10%
2017
0.21%
2.63%
0.42%
0.29%
1.40%
-0.34%
0.96%
0.60%
-0.38%
1.73%
0.22%
1.39%
9.47%
2018
1.18%
-1.17%
-1.33%
1.53%
0.52%
-0.26%
1.13%
-0.47%
0.53%
-2.88%
0.74%
-2.44%
-2.98%
2019
2.91%
0.53%
1.32%
1.88%
-1.71%
3.58%
2.58%
-0.98%
-0.41%
0.09%
0.67%
1.24%
12.21%
2020
-0.97%
-1.69%
-9.80%
4.26%
3.12%
1.21%
0.94%
1.64%
-0.02%
-0.23%
3.33%
1.52%
2.59%
2021
-1.17%
-0.41%
1.70%
3.17%
-0.32%
1.28%
0.07%
1.57%
5.97%
Performance figures from inception (30th September 2016) to end May 2017 are based on model portfolios, simulated from a full record of trading decisions and execution levels quoted, are readily available for review. Performance figures from June 2017 onwards are based on an aggregation of actual client portfolios whose mandate most closely follow the Moderate Risk model. Dividends have been included on an accruals basis in both cases. All performance is shown exclusive of fees as charging structures may vary. Your capital is at risk and past performance is not a reliable indicator of future performance.
Source: Saranac Partners, as at 30th August 2021. Inception: 30th September 2016.