
Research
There are a broad divergence of views from our research houses, ranging from a V-shaped recovery and swift return to normal, to a scenario in which the economy takes a second leg down and large negative revisions to growth and earnings expectations loom.
However, there is some consensus that we are now moving out of recession and that markets are unlikely to fall back to the levels seen in March given the various fiscal rescue and monetary stimulus packages in place.
The speed of recovery has also seen the technical aspects of the equity market, such as breadth and sentiment, improve significantly.
Scenarios
We have fine-tuned our scenario analysis to reflect the current macro environment as well as asset price valuations.
A slow normalisation remains the highest probability outcome, while an extended recession or V-shaped recovery look least likely.
Overall, our views favour scenarios that are generally positive for market returns, including the possibility of a stimulus-fuelled bull market with buoyant sentiment despite relatively weaker underlying growth.
However, our appetite for risk is tempered by both the risks of extended weakness in the macro environment and the potential for rising inflation, which would have worrisome implications for valuations of many asset classes.
Our scenario work also recognises that the potential upside to market returns is somewhat capped by the already expensive nature of many markets.
Macro environment
The macro environment has turned unequivocally positive in developed markets and we have seen a steady stream of stronger-than-expected economic data announcements.
PMI numbers have bounced sharply, with many manufacturing surveys in Europe and the US now back above the magic 50 level, suggesting renewed growth. Services data has also surprised to the upside, although not as strongly as their manufacturing counterparts, due to lockdown restrictions. But this is a good example of ‘better than expected’ not actually meaning ‘good’ as most service economies remain in contraction.
Employment figures have also generally been better than forecast, the US notably seeing a meaningful increase of 2.5 million jobs in April employment numbers when a decrease of 7.5 million was expected, followed up by another report of a huge 4.8 million recovery in jobs for May.
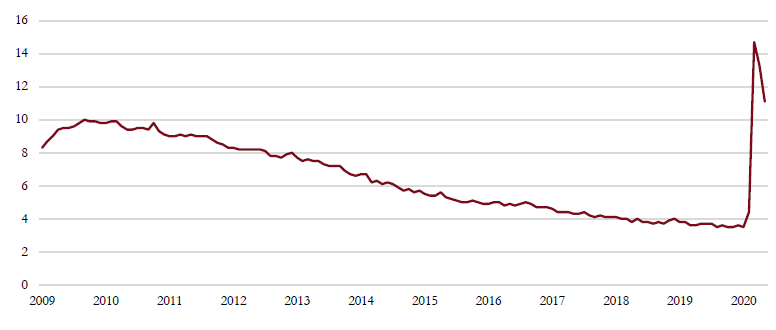
US employment rate (%)
US employment has staged a dramatic comeback in the past two months but unemployment numbers are still above the worst levels seen even during the Global Financial Crisis and have a long way still to go.
Source: Saranac Partners.
As a result, the Citigroup economic surprise index has moved sharply into positive territory, although US strength masks several other areas of weakness, notably Japan and emerging markets.
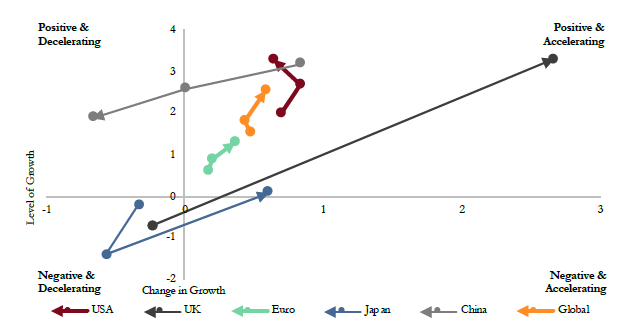
Our macro momentum indicator has surged from the most worrying ‘negative and decelerating’ quadrant far into the ‘negative and accelerating’ quadrant with some regions even already moving into the most encouraging quadrant ‘positive and accelerating’.
All this data reflects a bounce back from extraordinarily depressed levels. This base effect creates spectacular levels of growth in the short term but current data, however encouraging, does not reflect the likely shape of future growth into the end of this year.
Indeed, the re-acceleration in COVID-19 cases in the US has yet to be captured in the economic data and we are already seeing a reversal or delay in plans to further reopen important states such as Texas, Florida and California. This will have a significant impact on the pace of economic recovery in the US and act as a reminder to other geographies of the risks still present.
Despite the surprising drop in US unemployment figures, the outlook for employment, and consumption, remains opaque. The shape of this recession is unlike any other due to the immediate impact to the service sector, the most significant source of employment in developed economies and where the highest proportion of low income jobs are found.
Much of the damage to the employment picture has been mitigated by furlough schemes and additional unemployment benefits, most of which are set to expire in coming months.
As a result, the outlook for the macroeconomic picture is unusually dependent on policy, both fiscal and monetary.
Policy Stimulus
As it stands, we are at the point of maximum policy stimulus as several government schemes to alleviate the huge spike in unemployment claims in both Europe and the US are set to expire this quarter.
It would not be surprising to see some of these schemes extended, given the expected hit to incomes and unemployment rates. Nevertheless, at the margin, the positive impulse of fiscal policy has probably peaked.
In some respects central bank credibility has been more important in this crisis than actual monetary policy. Central banks, in particular the Fed, have restored both liquidity and confidence in markets without having had to deploy a large proportion of the liquidity they have promised and significant spending remains untapped at this stage. This is helpful, though the conditions that would require further central bank liquidity injections from central banks would not be market friendly.
There is a difficult path to be travelled over the coming months between the gradual improvement in the global economy, as output and employment improve, against the gradual withdrawal of stimulus.
Valuations
It is to be expected that, given the collapse in earnings over recent months, valuations would expand and this is typical of recessionary environments as earnings fall further than markets.
However, even when compared to prior recessions following the Global Financial Crisis of 2008 and the bursting of the tech bubble in 2001, valuations in this equity market are looking lofty.
MSCI World valuation: technology p/e vs ex-technology p/e
Technology stocks are trading at a significant premium to the rest of the market and are skewing the overall valuation of equity markets higher.
Source: Saranac Partners.
Some of this is a consequence of the outperformance of the tech and social media giants, which have benefited from the lockdown and seen a significant shift in consumption patterns in their favour. As a result, the premium paid for such businesses has grown and they clearly skew the overall valuation of the equity market to the high side.
Those parts of the market more orientated toward the physical economy, and in particular leisure and travel, offer far more attractive valuations but the near future is more uncertain.
We should also recognise that both inflation and interest rates are anchored at very low levels and it is unlikely that interest rates are going to move for some considerable time (the Fed stated it could be 2022 before they raise rates again).
In such an environment it is possible to argue for an expansion in equity valuations. But we think there is limited upside for equities to be found through valuations moving higher still, unless we move into a speculative stage not dissimilar to the late 1990s, stoked by generous policy stimulus.
Bond yields offer even less value, again, held down by aggressive monetary easing and low inflation. Indeed, equity continues to look good value when considered relative to bonds. Most government bond yields are now well below 1%, many are negative, while credit spreads have tightened significantly and are not far from the levels seen pre-COVID-19.
Investment grade bonds have benefited from the Fed’s explicit support, and so the attraction of such credit has diminished somewhat in recent weeks. High yield bonds have also seen yields fall, despite the risks of accelerating defaults into the end of this year.
As we look at the valuation picture, we believe much of the positive macro story, the surprisingly strong initial rebound from the low points in March/April, has already been priced into markets and we would need to see further positive surprises in the economic data moving into the second half of this year to justify further short term gains. Absent a breakthrough in a vaccine for COVID-19, such positive surprises may be harder to come by as the easy comparisons fade.