Scenarios

A significant input into our investment process is the construction of probability weighted, plausible scenarios representing alternative paths for the global economy.

These scenarios help us to frame our ‘central’ view on the most likely outcomes for economic growth over the next 12 to 18 months, but also assist in identifying and quantifying alternative outcomes, and therefore risks (both positive and negative), to our central view.

Our scenario analysis is centred on the pace of economic recovery and whether lost output is recovered over the next 12 to 18 months or takes significantly longer.

Damage to the global economy from Covid-19 and the subsequent lockdowns of society and the economy is still opaque, but we can be confident that the second quarter will be the trough in terms of lost output and negative rates of economic growth. Estimates of negative GDP of -10% to -12% in the second quarter look reasonable.

Policy stimulus, both fiscal and monetary, has been unprecedented and needs to be considered as a possible influence on market outturns.

Inflation is another hugely important consideration, not least for the valuation of the market and potential returns. We believe there is a tail risk, not present before, that inflation picks up meaningfully in the longer term, but near-term pricing pressures are clearly very weak.

We ascribe very low probability to a prolonged recession, in which the initial economic bounce is limited and the recovery anaemic, and to a V-shaped recovery, in which output rebounds to 2019 levels by early next year and trend growth resumes.

We give some credence to the scenario in which, after a reasonable initial bounce, the economy struggles to gain much momentum due to second waves of infection, prolonged social distancing, unemployment and weak consumer confidence. Economic output remains below 2019 levels until late 2022.

Our highest probability goes to the scenario whereby there is a slow normalisation in the economy which sees the economy, and corporate earnings, recover their lost ground by the end of next year.

Macro drivers

After the collapse in activity in March and April, we saw a definite pick-up in macroeconomic data in May.

Most economic data points are at levels still in deep recessionary territory, but they have bounced strongly from the record lows of the previous month.

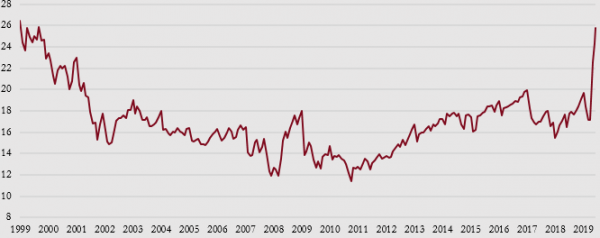
As an example, European PMIs, which survey business sentiment, rebounded from 13 to 31 in May. However, that is still the third-worst reading on record, and economic expansion is typically associated with levels above 50, while a ‘normal recession’ is a drop to 45.

Our macro momentum indicators have moved sharply from the zone of ‘negative and falling’ to the more encouraging category of ‘negative and accelerating’.

Unemployment is an area where policy decisions have played a major part. US unemployment has risen by 40 million people and is close to 20%, as companies cut jobs and unemployment benefits have kicked in. European unemployment has barely moved as furlough programmes mean that employers have yet to cut their workforce.

As these fiscal programmes expire but lockdown pressures ease, we expect unemployment levels to fall in the US but rise in Europe and the UK through the second half of the year. Indeed, US employment figures for May stunned the market as an expected loss of 7 million jobs actually turned out to be a gain of 2.5 million jobs.

Encouragingly, there remains no evidence of a second wave of Covid-19 cases in countries where lockdown restrictions have been lifted. The US has seen huge improvement in New York, but there are some 17 states where cases are still rising. Latin America now seems to be the epicentre of the pandemic.

Economic Stimulus

When compared with 2008, government and central bank responses occurred much earlier in the crisis, and the scale has been more material. Moreover, policymakers continue to respond to Covid-19 stresses in innovative ways.

Governments and central banks, most notably the US Federal Reserve, have deployed not just unprecedented monetary support for markets, but also extensive fiscal intervention to provide cash flow to individuals and businesses.

Undoubtedly the speed and strength of the policy response was critical in initially stabilising and then supporting the material rallies in risk assets. The policy response has also provided markets with some reassurance about the future.

However, there are limits to the mitigating impacts of policy responses. While the scale of policy intervention has been unprecedented, estimates across developed economies quantify this intervention at 3.5% of GDP. Compared with estimates of GDP contraction of around 10%, it is clear that policy intervention will not have prevented a recession of unmatched severity.

Furthermore, fiscal programmes are likely to be wound down as we head towards the end of the year. While we do not expect a return to austerity, there will likely be some attempts to contain and reverse fiscal deficits.

In aggregate, while we believe policy has been extremely effective in mitigating the worst impacts of the pandemic, we are sceptical that interventions will be sufficient to support a sustained recovery ahead of late 2021.

Overall

Our central view is that economies will see a slow normalisation whereby corporate earnings return to pre-crisis levels by the end of 2021.

We also recognise that within this scenario of gradual rebound is the possibility that markets are lifted beyond what would be considered normal, to higher levels boosted by the sheer scale of monetary stimulus. Shortly after our monthly Investment Committee meeting, the European Central Bank announced a €600 billion extension to its emergency bond-buying programme.

Furthermore, portfolios currently have little or no exposure to the more cyclical areas of the equity market, which still offer some levels of value and have started to show improved performance.

We are therefore increasing the equity allocation through the selective addition of specific names which bring greater balance to our equity position and raise our exposure to the higher-quality stocks in the more cyclical sectors, such as manufacturing, hotels and retail.

Our concerns about Brexit and the sharp move lower by the US dollar also led us to reduce the proportion of US dollars that we hedge in our sterling portfolios. If we see renewed weakness in sterling then portfolios will benefit from this reduction in currency hedges.

Equities

The extent of the equity rally since late March has exceeded expectations. Investors have focused on the improving virus data and rebound in economic activity, with growing hope that the recovery is more V-shaped than L-shaped.

Secular ‘winners’ in the tech and healthcare space led the initial rally. However, as confidence in an economic rebound has risen in the last two weeks, the equity rally has broadened out and we have seen formerly unloved, value areas of the market, such as industrials, energy and financials, perform better than the more defensive and secular growth names.

These more cyclical and economically sensitive parts of the market are still significantly lower over the year (unlike many tech stocks) and offer better value over the medium term.

Corporate earnings are likely to be down 25% to 30% this year, but the market is more interested in the level to which earnings recover in 2021.

A slow normalisation scenario should get us to a similar run rate of earnings enjoyed at the end of last year by the end of 2021.

In such an outcome, valuations are far from cheap, with the US equity market on 20 times next year’s potential earnings (see chart below). However, a background of very low bond yields and very easy monetary conditions could bolster valuations.


S&P 500 prospective p/e ratio

Equity valuations have expanded to near record highs as earnings have collapsed just as the market has rebounded. A strong recovery in earnings through 2021 is now priced in.

Source: Saranac Partners


Fixed Income

As with equities, fixed income markets have enjoyed a strong rally, buoyed by the support of central banks, and we have seen strong inflows back into bonds.

Investment grade bonds are now making positive returns for the year, while high yield and emerging market debt have recovered more than half their original losses.

We made significant increases to our investment grade positions last month, focusing on the US corporate bond market. We have also added inflation-protected US Treasuries to portfolios as expectations of 1% inflation for the next 10 years look too low and this looks a very cheap hedge against a possible rise in inflation in the medium term.

Defaults in the high yield space remain our primary concern and we are not yet confident that this has been fully priced in, so we remain on the sidelines in this area.

Government bond yields remain at record low levels, implying either very weak growth ahead or the risk that central banks may intervene to keep bond yields low and borrowing cheap.

Alternatives

We continue to hold a meaningful allocation to gold in portfolios, although we took the opportunity to trim positions and take profits when the price reached $1,740 recently. But we remain constructive on gold as both an inflation hedge and safe-haven asset.

If interest rates and bond yields are held down by central banks to ensure a robust recovery then even a modest increase in inflation would likely be a positive influence on the gold price.

Currencies

The US dollar has been one of the most resilient currencies through this crisis, notwithstanding the significant deficits being run up by both the US Treasury and the Federal Reserve.

However, the most recent rally in markets has seen a noticeable weakening in the US dollar, which has been helpful to emerging markets in particular given their dollar debt exposures.

The euro has also rebounded recently, lifted by the positive developments announced by the EU in terms of jointly issued debt, paid for by EU-wide taxes, to help finance those parts of the EU most in need of assistance.

Dollar weakness has also seen sterling move higher, though we are minded to sell into that strength as the issue of a no-deal Brexit has reared its ugly head again, potentially undermining prospects for the UK economy ahead.

Portfolio Performance

Current Asset Allocation

Performance

Monthly Returns

Jan Feb Mar Apr May Jun Jul Aug Sep Oct Nov Dec Total
2016 -0.09% 0.74% -1.55% 1.93% 1.00%
2017 0.21% 2.63% 0.42% 0.29% 1.40% -0.36% 0.92% 0.59% -0.38% 1.69% 0.20% 1.39% 9.35%
2018 1.21% -1.18% -1.39% 1.55% 0.55% -0.27% 1.11% -0.49% 0.58% -2.89% 0.64% -2.43% -3.08%
2019 2.97% 0.53% 1.30% 1.85% -1.67%  3.54% 2.49%  -0.96%  -0.36%  0.06%  0.66%  1.23% 12.16%
2020 -0.95%  -1.73%  -9.84%  4.25%  3.12% -5.66%

Performance figures from inception (28th September 2016) to end May 2017 are based on model portfolios, simulated from a full record of trading decisions and execution levels quoted, are readily available for review. Performance figures from June 2017 onwards are based on an aggregation of actual client portfolios whose mandate most closely follow the Moderate Risk model. Dividends have been included on an accruals basis in both cases. All performance is shown exclusive of fees as charging structures may vary. Your capital is at risk and past performance is not a reliable indicator of future performance.

Source: Saranac Partners, as at 31 st May 2020. Inception: 28th September 2016.