The global spread of Covid-19 has stopped the embryonic economic upswing in its tracks. A sharp contraction in activity now seems inevitable as a growing number of countries take dramatic steps to contain the virus.

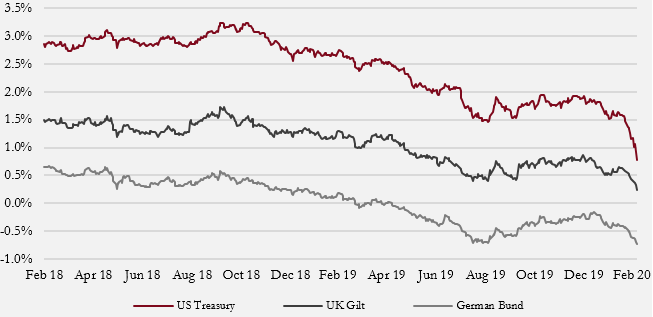
We highlighted market complacency over the outbreak in China last month, and risk assets corrected sharply as the virus spread to other countries. Global equities fell over 12% in less than a week, while safe-haven assets rallied strongly, including government bonds and gold.

Our questions now focus on the possible outcomes for the global economy in response to the efforts to contain the virus, and to what extent market movements have already discounted these possibilities.

For several months we had been encouraged by signs that the global economic downturn, which began in early 2018, was coming to an end and a new upswing in growth was upon us. This narrative has now collapsed as economic growth has turned sharply negative in certain regions, in particular China, due to the steps taken to contain the spread of the coronavirus (figure 1). These measures have essentially cut off the supply of labour to many parts of the economy.


Figure 1: Economic surprise indices

Economic indicators had been coming in ahead of consensus forecasts but the collapse in Chinese data is an early signal of the deterioration to come globally.
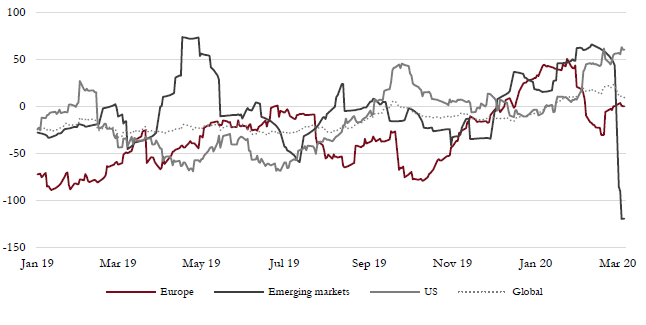
Figure 1

Source: Bloomberg.


Given China’s importance to the global economy (16% of global GDP) and its integral role in the global supply chain, the damage to growth in other parts of the world is also likely to see economic growth rates turn negative in much of the developed world.

The rapid spread of the virus to other countries such as South Korea, Singapore, Iran and Italy has now compounded the problem and the potential negative impact to growth is now more significant.

The extent to which the global economy contracts is now highly uncertain and it is this uncertainty that triggered the sharp correction in risk assets.

Macro drivers: coronavirus

We are not virology experts (nor is most of the market) and so we do not pretend to have an understanding of how this virus will ultimately affect the health of the global population. However, we do need to build a framework that helps us determine the possible outcomes for the global economy and asset prices as this is crucial to our thinking around portfolio construction and the risks we take for clients.

We’ve developed the following three broad scenarios to suggest how the spread of, and recovery from, the coronavirus could impact the global economic outlook.

Scenario 1:

The growth rate of recorded instances in countries already infected peaks in the next three to four weeks and follows a similar pattern to China, with new cases dropping sharply. The coronavirus does not spread to other parts of Europe, Asia or North America and activity rebounds to more normal levels early in the second quarter as the situation is deemed to be under control. Economic data holds up and there is a rapid pick-up in growth.

Scenario 2:

The virus spreads to other parts of Europe and North America and the growth in recorded cases peaks in two to three months, resulting in a more damaging contraction in activity for a more prolonged period. First-quarter data is weak and second-quarter economic data is worse, but we see a robust rebound in growth in the second half of the year, boosted by monetary and fiscal policy response, and the global expansion continues.

Scenario 3:

The virus spreads to other parts of the world and proves difficult to contain, leading to a deep and prolonged contraction in economic growth. The disruption to activity results in a spike in bankruptcies, credit conditions tighten significantly and the global economy falls into recession as unemployment rises and concerns rise over leverage levels.

Market implications for these different scenarios vary significantly. In scenario 1 markets are likely to rise from here as the correction has already discounted the bad news. Bond yields would also rise (and prices would fall). Scenario 2 could see continued volatility in the coming weeks and the possibility of another correction that would take equity markets 15–20% lower than their highs and widen credit spreads. In scenario 3 a bear market in equities (down 30–40% from their highs) is likely, with lower bond yields but wider spreads, and gold prices could rise significantly.

We place the overwhelming probability on scenario 2 (70%), but recognise that both the positive and negative outcomes are also plausible.

Portfolio Positioning

Overall

We reiterate the advantages of a well-diversified portfolio during periods of high uncertainty (figure 3). The protection we put in portfolios at the start of February is proving helpful, as are the fixed income and gold assets that have offset some of the equity volatility. We do not want to reduce that diversification at this point.


Figure 3: Multi-asset strategy (sterling moderate risk)

Figure 3 grey

Source: Saranac Partners.


Consequently, we are making only small changes to portfolios at this time. We are taking advantage of the improved yields within the high-yield space and increasing our exposure to senior loans, which tend to have a higher credit quality than the broader high-yield market. We are also focusing on active management within this asset class to ensure we manage our exposure to problem areas such as energy.

We think gold continues to make sense in portfolios as a tail-risk hedge and we have a significant position already. We are looking to increase our exposure further as gold prices have not responded to recent events in as positive a fashion as we would expect. We believe there remains upside to the gold price, in the event that disruption from the coronavirus is worse than expected.

Equities

Equity valuations have fallen by around 10% over the past few days. However, it would be wrong to say that there are ‘bargains’ to be found.

Under scenario 2 we would expect earnings growth to be zero this year, which is a material downward revision from the 6–8% growth previously forecast. However, 2021 earnings growth would likely be strong. With no earnings growth this year, valuations may be higher than the market currently believes.

While much attention has been paid to the concentration of performance in a relatively small number of large-cap growth stocks, these names have not underperformed in this correction to date. Cyclical sectors such as energy, mining and leisure have borne the brunt of the most negative performance, as have financials, which now have to contend with even lower interest rates and bond yields. Value has clearly lagged behind growth.

Equity markets seem to be discounting a relatively benign outcome, something between scenario 1 and 2.

Fixed Income

Government bond yields have fallen to record lows, in anticipation of a dramatic drop in economic growth and an associated policy response (figure 2). However, the recent interest rate cut by the US Federal Reserve (a surprise 50bp cut in early March) has seen the US yield curve steepen.

Figure 2: Flight to safety

10-year government bond yields have fallen to record lows in anticipation of a sharp economic weakness and central bank easing.

Figure 2 grey

Source: Bloomberg.

This would imply a belief that a full-blown recession will be avoided in the medium term as an inverted yield curve is considered a strong signal for recession. A steepening of the yield curve implies the opposite.

Credit spreads are another useful indicator of stress in the economy and these have certainly widened, but only to average levels that were in place one to two years ago. Only energy markets seem to be showing distress, but that is more a function of high leverage and a vulnerability to the oil price.

So the broader fixed income markets are also supporting the view that there is no recession in sight and growth will recover later in the year.

Gold

Gold has been a clear beneficiary of the flight to safety. However, it has also prospered as the drop in bond yields has meant that real yields, as adjusted for inflation, have turned even more negative and the relative attraction of gold has improved.

Currencies

Currencies have seen quite a lot of activity and, for once, it doesn’t relate to sterling or Brexit. Swiss francs and Japanese yen have strengthened due to their traditional safe-haven status, but we have also seen the US dollar weaken in anticipation that the Fed could cut rates by as much as 1%. This narrowing in the differential of interest rates between the US and the rest of the developed world has resulted in the reversal of capital flows into the US, weakening the dollar and helping lift other currencies, including the euro.

Our investment team recognises the opaqueness of the near-term outlook but we agree that the broad themes of monetary policy backdrop, valuation and inflation have all improved and are supportive. However, the risks to the economic cycle have risen and are particularly difficult to forecast given the nature of the threat.

On a crude scale of 1-to-10 in terms of risk appetite, our tolerance for risk remains in the same area as before, at around 4/10. This reflects our concern about the possible downside to growth from here but also the positive impact of concerted and increasingly coordinated policy easing.

Portfolio Performance

Current Asset Allocation

Performance

Monthly Returns

Jan Feb Mar Apr May Jun Jul Aug Sep Oct Nov Dec Total
2016 -0.09% 0.74% -1.55% 1.93% 1.00%
2017 0.21% 2.63% 0.42% 0.29% 1.40% -0.36% 0.92% 0.59% -0.38% 1.69% 0.20% 1.39% 9.35%
2018 1.21% -1.18% -1.39% 1.55% 0.55% -0.27% 1.11% -0.49% 0.58% -2.89% 0.64% -2.43% -3.08%
2019 2.97% 0.53% 1.30% 1.85% -1.67%  3.54% 2.49%  -0.96%  -0.36%  0.06%  0.66%  1.23% 12.16%
2020 -0.93%  -1.82% -2.73%

Performance figures from inception (28th September 2016) to end May 2017 are based on model portfolios, simulated from a full record of trading decisions and execution levels quoted, are readily available for review. Performance figures from June 2017 onwards are based on an aggregation of actual client portfolios whose mandate most closely follow the Moderate Risk model. Dividends have been included on an accruals basis in both cases. All performance is shown exclusive of fees as charging structures may vary. Your capital is at risk and past performance is not a reliable indicator of future performance.

Source: Saranac Partners, as at 28th February 2020. Inception: 28th September 2016.