
Macro environment
Over the last couple of months we have noted the strength of the global recovery from the depths of the slowdown in the second quarter. We now, however, have identified a potentially important turning point in global economic conditions.
The rebound in economic activity which emerged mid-year was very powerful, but there have been some signs in recent weeks of a levelling off in a number of countries. PMI data in Europe and China, while still positive, has plateaued; European and Japanese retail sales fell back in July; and permanent unemployment rates in the developed world are moving higher.
This is potentially important because strong growth momentum typically supports risk assets while softer periods provide less support. We believe that we are transitioning into a somewhat softer period for the global economy – potentially including a fall in GDP in the US in the fourth quarter. As government support programmes fade, the impetus from the initial bounce is also fading. Furthermore, potentially higher infection rates of Covid-19 may act as grit in the wheels of economic growth.
Inflation
We continue to believe that this remains a low inflation environment. While in the US there is some potential for gradual upward creep over the medium term, this is not inevitable, and we do not believe it is an immediate market issue.
There are good reasons to think that inflation may move higher in the medium term. They include the size of policy response and printing of money; the willingness of central banks to tolerate higher inflation (as evidenced by the Fed’s shifting to an average inflation target); supply chain disruptions; and gradual stalling of the globalisation trend. In addition, governments have committed to huge spending plans to address the collapse in demand, and higher inflation is by far the most palatable political route to shrink deficits over time.
However, there remains strong evidence that creating inflation will be difficult, particularly in an environment of high unemployment; unfavourable demographics as populations age and retire; and the proliferation of unproductive ‘zombie’ companies sustained only by rock-bottom interest rates.
Furthermore, inflation has remained well below target this past decade despite aggressive monetary easing and stimulus over that time. It is not easy to move inflation expectations by monetary policy alone. Technology and the de-unionisation of the labour force are further disinflationary forces to deal with.
As a result, we believe central banks are likely to anchor policy rates at very low levels for an extended period.
Sentiment / Momentum
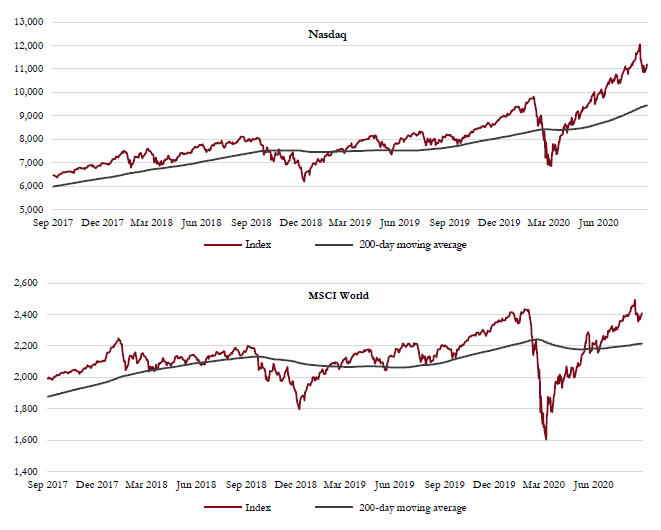
Very few of the sentiment, positioning and technical indicators that we look at were indicating a speculative environment for risk assets before the recent sell-off. The Nasdaq stood out as an exception in this context, and there has since been a meaningful correction. Therefore, we do not regard the current environment as either very risk-on or risk-off.
Nasdaq vs MSCI World : The tech-heavy Nasdaq index had moved well above its long-term moving average by late August, indicating a momentum driven market which had run ahead of itself. The global equity market looked far less extended by comparison.
Source: Saranac Partners.
Our own risk monitor is at a neutral reading and there is conflicting data from other well-known sentiment measures. For instance, the Dow Jones Bull/Bear Ratio is at a worryingly optimistic level whereas the AAII Bull/Bear Ratio shows deep pessimism.
What remains clear is that there are pockets of overvaluation and extreme optimism which are not representative of the broader market but do constitute a lot of market capitalisation. Technology and the Nasdaq indices again are the main offenders here and this is another example of the increasing risk of concentration in the equity market.
We have highlighted before the disproportionate outperformance of the market cap weighted S&P500 vs the equal weighted S&P500. While over the longer term the equal weight index tends to outperform the market cap weight, it is not unusual for this to reverse. However, the degree of market cap weighted outperformance is unusual and speaks to the huge success of the mega-cap internet and tech stocks in recent years.
Cap weighted vs equal weighted S&P500: The market cap weighted S&P500 continues to outperform the equal weighted index as mega-cap concentration intensifies. A broad-based economic recovery should see this relationship reverse.
Source: Saranac Partners.
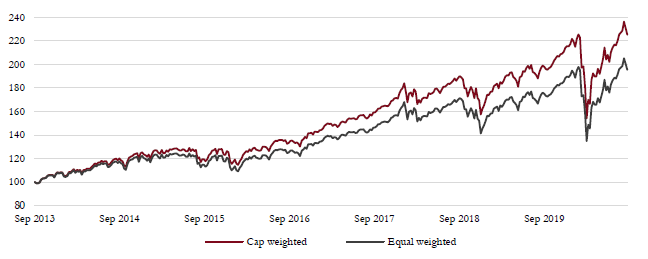
Outperformance of the market cap weighted index is often associated with the latter stages of the business cycle and in a recession this gap typically widens further. As you begin to come out of a recession you expect to see the equal weight index perform better as investors rotate back into cheap stocks which have lagged and offer better value and thus market breadth improves significantly. This leads to the equal weight index leading in a recovery, a situation which has yet to evolve in current markets.
Valuations
The dispersion in equity performance and valuations has made generalisations about valuations less helpful. Nevertheless, at the aggregate level the forward price–earnings (p/e) multiple on global equities is close to a 20-year high. Perhaps this is warranted to some extent by the low level of real interest rates, but our interpretation is that, on average, a fairly benign background is priced in for the coming year or so. This outturn is not implausible, but it is far from inevitable.
Global equity valuations are around 20x for the next 12-month earnings, which is higher than any other period outside of the 1999–2001 tech bubble. However, global equity valuations excluding the US are 16.5x for the next 12-month earnings, which is still an elevated level but less extreme than the US itself which currently trades at 24x.
The disparity between sectors is even wider as the consumer discretionary sector, as measured by MSCI on a global scale, now trades at a p/e of 30x and the technology sector trades at 27x whereas financials are trading at 11.5x and healthcare is at 18x.
High yield and investment grade bond credit spreads: Credit spreads have continued to tighten as markets rebound from the lockdown crisis. Spreads are at average levels, but absolute yields are very low.
Source: Saranac Partners.
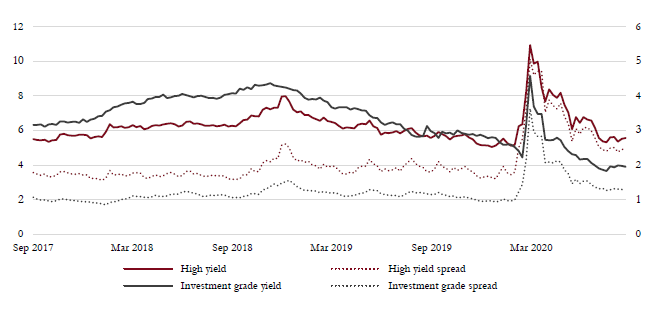
Notwithstanding the lofty valuations in equity markets, fixed income valuations remain… unhelpful. 10-year government bond yields in the major markets yield between 0.7% (in the US) to -0.45% (Germany), providing little or no return to investors. In addition, credit spreads have narrowed significantly over the past five months and now the additional yield offered by riskier credits is no better than average.
Geopolitics
While it is important to understand the political environment, it is hard to forecast, so we typically do not give it a high weight in decision making. However, the US presidential election appears more likely to generate a pick-up in volatility than usual, and Brexit risks are rising.
The likelihood of a delayed result in the US election is rising given the time it takes to count votes that are mailed in, rather than voted in person. A New York Times poll showed that 80% of Republicans in Minnesota intend to vote in person on election day against only 35% of Democrats, which is a pattern emerging across many of the key swing states. Experience shows that a high proportion of voting by mail can delay the result by as much as two weeks. As a result, the potential for a contested election result through early November looks high.
This background makes us somewhat cautious over the near term.
Against this, a positive ‘shock’ would be better news about a vaccine or effective treatment for Covid-19.